Bitcoin's nominal price will exceed $100,000 in 2025, but Galaxy's head of research, Alex Thorn, pointed out that when adjusted for inflation using 2020 dollars, the actual purchasing power is only about $99,848. The US CPI shows that the average for 2020 was 258.8, rising to around 320 by the end of 2025, indicating a decrease in the purchasing power of the dollar by about 20%.
The Truth of the Inflation Calculation Behind the Myth of Bitcoin at 100,000 USD
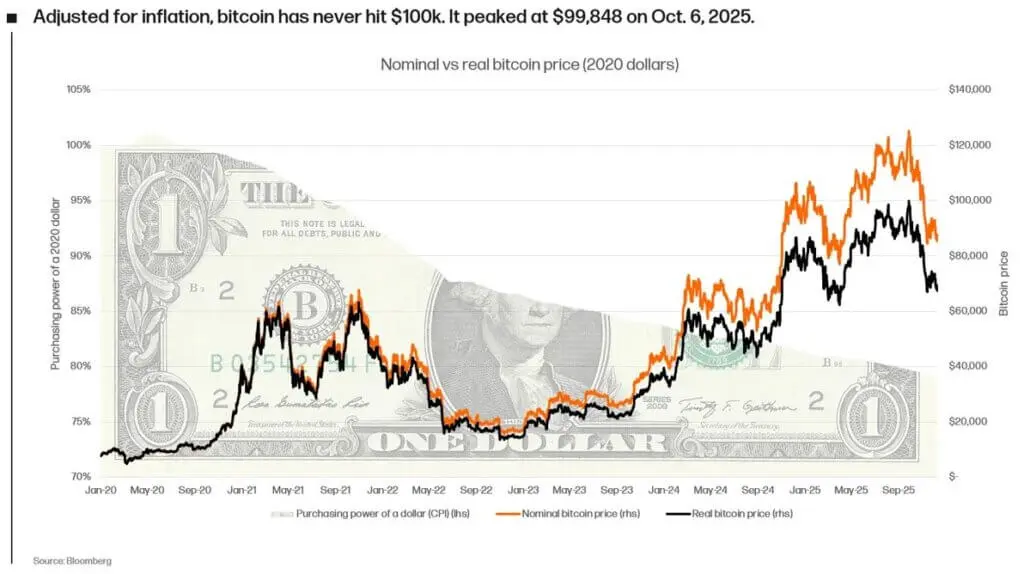
(Source: Bloomberg)
On the day when the price of Bitcoin finally broke through the 100,000 USD mark, many people took screenshots, saved them, and sent them to group chats accompanied by rocket emoticons. It felt like a period was placed, as if the market had finally fulfilled the promise it made long ago. Then, a chart began to circulate, quietly causing the atmosphere to suddenly cool down.
If you ask most people what the impact of inflation is, they would say it causes prices to rise. This is true, but it is only half of the problem. The other half is that inflation changes the real value of the dollar. The 100 dollars from 2020 cannot buy the same things as the 100 dollars at the end of 2025; the amount of labor, rent, groceries, or time they represent is also different.
Mathematical Evidence of Purchasing Power Erosion
CPI Benchmark Change: The average value in 2020 was approximately 258.8, and it is expected to reach 320 by the end of 2025, an increase of approximately 23.6%.
Conversion Factor: To convert the nominal price of the year 2025 into 2020 dollars, it needs to be multiplied by approximately 0.8.
Real Purchasing Power: $100,000 nominal price in 2025 = approximately $80,000 real purchasing power in 2020
Threshold: To achieve a purchasing power of 100,000 dollars in 2020, the nominal price must be close to 125,000 dollars.
This means that the milestone event that the market is celebrating is indeed real, but it is different from what is perceived as a milestone event online. The chart by Alex Thorn, the research director at Galaxy, further amplifies this point, and its conclusion is simple yet somewhat harsh: if we adjust the price of Bitcoin for inflation using 2020 dollars, Bitcoin has actually never broken through the $100,000 barrier.
The more embarrassing thing is that Reuters tracking shows the cycle peak of Bitcoin happens to fall around the $125,000 area. If you plug the peak value into a simple CPI adjustment factor, you will get a figure close to $100,000 in 2020. That’s why the question of “did it really happen” is hard to conclude.
The Actual Return Dilemma in the Eyes of Institutions
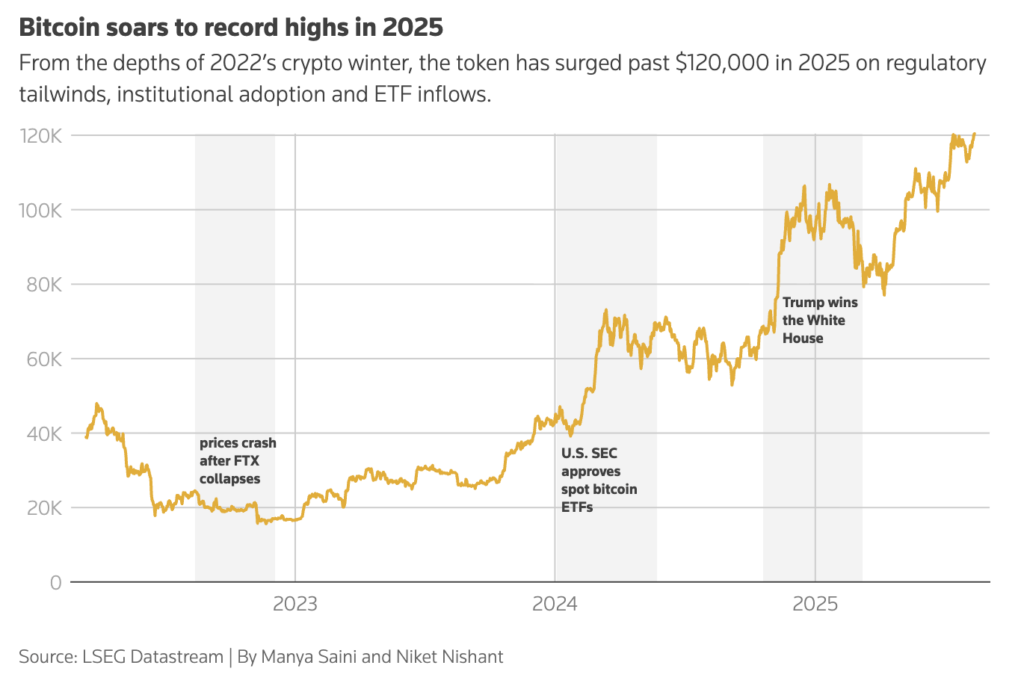
(Source: Reuters)
The characteristic of this cycle is that institutional investors are entering the market through spot Bitcoin ETFs, the macroeconomic narrative changes every few weeks, and the market seems to be linked to interest rate expectations. When you measure Bitcoin with actual prices, you force the discussion back to the realm where institutions have always been: actual returns.
If inflation remains high and the risk-free interest rate is enticing, retirement funds do not care if the nominal price of an asset has risen by 20%. If Bitcoin wants to grow into a true macro asset, it must ultimately be assessed like all other assets, that is, based on returns after deducting inflation factors and in relation to the returns of other investment targets. Retail traders rarely think about this when celebrating integer thresholds, but institutions calculate this every day.
The market's sluggish state after reaching a peak indicates that people have already felt this. Bitcoin significantly retraced after its peak in October, with prices falling about 30% by December. According to CryptoSlate data, the assets under management for the U.S. spot Bitcoin ETF peaked at approximately $169.5 billion on October 6, before falling to about $120.7 billion by December 4. Direction is important; the market completed the hardest part, breaking through six figures, but then struggled to convert this emotional victory into a stable new bottom.
The Contradictory Signal of a Market Cap Reaching a New High of 1.125 Trillion
The following paragraph ensures that this story does not become a frustrating one. On the surface, the cost basis situation of Bitcoin appears to be much more solid than what the price trends indicate. This year, the actual market value of Bitcoin reached a historic high of about $1.125 trillion, which means that the amount of Bitcoin held is greater than ever before, and the price is also higher.
The actual market value reflects the level of popularity of Bitcoin and the real situation of long-term holders, indicating that over time, the network is absorbing funds at a higher level. Therefore, on one hand, the market is still debating whether the actual purchasing power has truly broken through historic thresholds; on the other hand, the “average cost” in the market is rising and setting new records. Both statements may hold true, which is one of the reasons why Bitcoin can withstand extreme price fluctuations.
Three Paths and the True Goal in 2026
Citibank's forecast framework for 2026 includes three scenarios: a base case of approximately $143,000, an optimistic case of over $189,000, and a pessimistic case of about $78,500, where ETF fund flows and market acceptance are key factors. If inflation cools following the path predicted by policymakers, the nominal threshold for achieving actual milestones will rise more slowly. If inflation remains high, it may eventually lead to a cycle where Bitcoin reaches a new nominal high but purchasing power remains unsatisfactory. If ETF demand accelerates again, even in a turbulent macro environment, the market can break through resistance levels adjusted for inflation.
The first question worth asking when the price of Bitcoin reaches an integer again is not whether this number is real, but rather what this number can buy.
Disclaimer: The information on this page may come from third parties and does not represent the views or opinions of Gate. The content displayed on this page is for reference only and does not constitute any financial, investment, or legal advice. Gate does not guarantee the accuracy or completeness of the information and shall not be liable for any losses arising from the use of this information. Virtual asset investments carry high risks and are subject to significant price volatility. You may lose all of your invested principal. Please fully understand the relevant risks and make prudent decisions based on your own financial situation and risk tolerance. For details, please refer to
Disclaimer.
Related Articles
The Crypto Fear and Greed Index rose to 16, and market panic sentiment eased slightly
Gate News update: On April 12, according to Alternative Data, today’s Crypto Fear and Greed Index is 16 (15 yesterday), and market panic sentiment has eased slightly. The index runs on a threshold of 0-100 and is calculated from six indicators: volatility (25%), market trading volume (25%), social media buzz (15%), market survey (15%), Bitcoin’s share of the entire market (10%), and Google keyword trend analysis (10%).
GateNews1h ago
Market Overreactions? MicroStrategy Founder: Bitcoin Has Hit Bottom, Quantum Threats Are Overblown Concerns
Michael Saylor asserted that Bitcoin has already completed a bottoming process when it reached $60k, and he believes concerns about threats from quantum computers are overstated. He predicts that in the future, Bitcoin will become the core of a digital credit system, and he noted that the market’s selling pressure is limited, which could help drive a new bull market. Mizuho also gave a positive assessment of the company’s future performance.
CryptoCity2h ago
BTC 15-minute drop of 0.45%: Aggressive sell-side orders lead, layered with weakening liquidity at the margin, amplifying volatility
2026-04-11 23:00 to 2026-04-11 23:15(UTC), BTC’s return over 15 minutes was -0.45%, and the price fluctuated within the range of 72907.4 to 73370.7 USDT, with a swing amplitude of 0.63%. During this period, market activity remains at a high level, but the price anomaly has drawn investors’ short-term attention. Overall trading sentiment is slightly cautious, and volatility is marginally higher than usual.
The main driver behind this anomaly is that active sell orders have a slight advantage, causing a short-term downward adjustment in price. Combined with a modest increase in trading volume for major trading pairs and spot
GateNews3h ago
Market in Excessive Panic? MicroStrategy Founder: Bitcoin Has Bottomed, Quantum Threats Are Overblown Worry
Michael Saylor asserts that Bitcoin has finished bottoming out when it hit $60k, and he believes concerns about threats from quantum computers are overblown. He predicts that in the future, Bitcoin will become the core of a digital credit system, and he notes that there is limited selling pressure in the market, which could help drive a new bull run. Mizuho also has a positive assessment of the company’s future performance.
CryptoCity5h ago
Market panic too much? MicroStrategy founder: Bitcoin has hit bottom, quantum threats are unfounded worry
Michael Saylor asserts that Bitcoin has already finished bottoming out at $60k, and believes concerns about threats from quantum computers are overstated. He predicts that in the future, Bitcoin will become the core of a digital credit system, and also noted that there is limited selling pressure in the market, which could drive a new bull cycle. Mizuho has a positive assessment of its company’s future performance.
CryptoCity9h ago
XRP CLARITY Act Vote in Focus as XRP Holds $1.34 and Senate Returns April 13
XRP is trading at $1.34 as traders await the Senate's action on the XRP CLARITY Act, with potential for significant ETF inflows. The Banking Committee's markup is expected in late April, crucial for defining XRP’s regulatory status.
Cryptonews9h ago
