Analysts point out that Bitcoin is hovering near the “critically important long-term support line,” and it has struggled to hold this level for 3 weeks, leaving the long positions in the market on edge. However, as the largest Bitcoin holder in the world, the publicly traded company Strategy (MSTR) has already seen its stock price break this “safety line,” sending a strong bearish signal to the crypto assets market.
CoinDesk senior analyst and Chartered Market Technician Omkar Godbole explained that this “safety line” is the extremely critical “100-week Simple Moving Average (100-week SMA)” in technical analysis, which mainly reflects the average cost over the past two years. It is used by major market technical analysts to identify significant trend reversals, long-term support, or confirm crashes.
From the trend perspective, the 100-week moving average has provided strong support for three consecutive weeks, allowing Bitcoin to halt its severe fall from the historical high of 126,000 USD.
Omkar Godbole describes this moving average as a “safety net” that successfully catches Bitcoin when the price falls.
If the coin price can rebound here, the market will expect this support to act as a “springboard”, becoming the starting point for a new wave of counterattack; on the contrary, once the coin price falls below the 100-week moving average, it may lead to a loss of confidence among holders, increased selling pressure, allowing the bears to gain further control, and the downtrend may also expand accordingly.
Concerningly, the stock price trend of Strategy (MSTR) seems to have already rehearsed the worst-case scenario. Please see the trend comparison in the chart below:
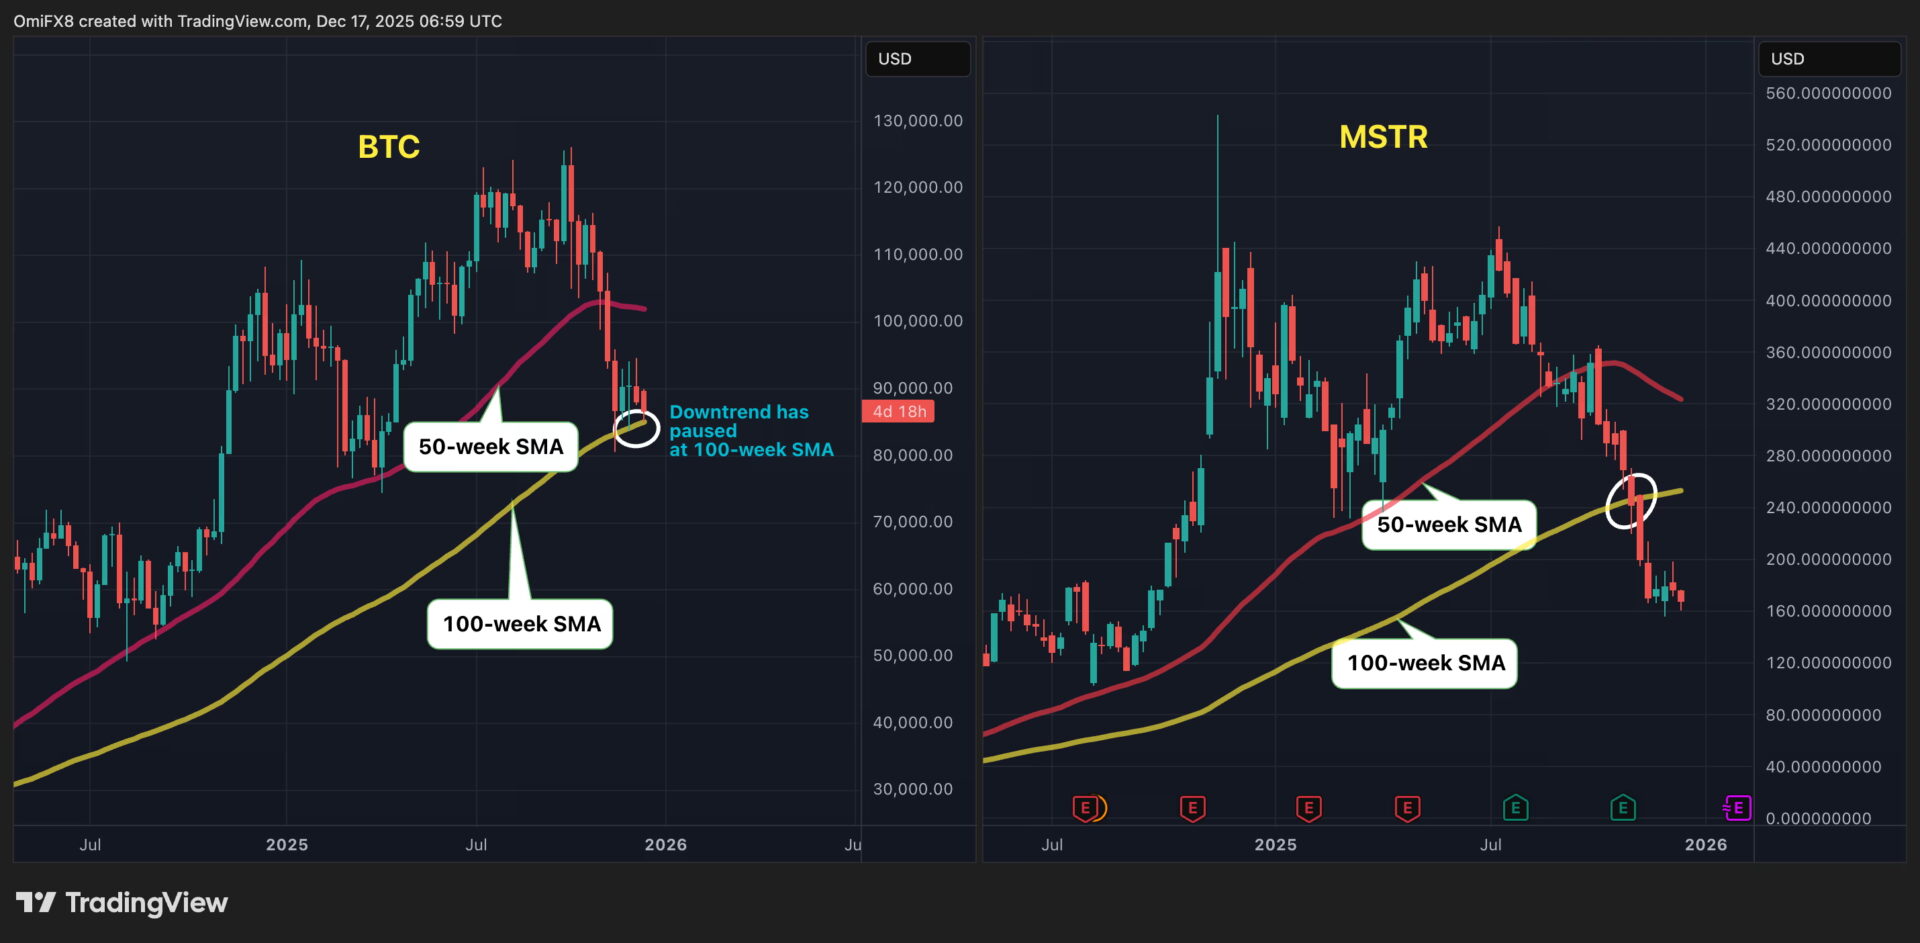
The MSTR stock price fell below the 100-week moving average when it dropped to $220 in early November, and the selling pressure continued to expand, causing the stock price to drop all the way down to $160, a decline of over 60% from this year's high of $457.
For Bitcoin long positions, this is a signal that cannot be ignored, as MSTR has previously led Bitcoin trends multiple times. Earlier, when MSTR fell below the 50-week SMA, which is also considered a long-term trend watershed, it also predicted that Bitcoin's subsequent market would weaken.
The current situation is very clear: Bitcoin long positions must defend the 100-week moving average at all costs.
If it can hold, this will become the starting point of a counterattack; if unfortunately it falls, Bitcoin may follow in MSTR's footsteps, sinking into a deeper fall.
_
Disclaimer: This article is intended to provide market information only. All content and opinions are for reference only and do not constitute investment advice, nor do they represent the views and positions of the blockchain. Investors should make their own decisions and transactions. The author and the blockchain will not bear any responsibility for any direct or indirect losses arising from investors' transactions.
_
Tags: 100-week Simple Moving Average 100-week SMA Omkar Godbole Analysis of Crypto Assets Market Coin Price Investment Support Bitcoin Moving Average Trend
Disclaimer: The information on this page may come from third parties and does not represent the views or opinions of Gate. The content displayed on this page is for reference only and does not constitute any financial, investment, or legal advice. Gate does not guarantee the accuracy or completeness of the information and shall not be liable for any losses arising from the use of this information. Virtual asset investments carry high risks and are subject to significant price volatility. You may lose all of your invested principal. Please fully understand the relevant risks and make prudent decisions based on your own financial situation and risk tolerance. For details, please refer to
Disclaimer.
Related Articles
XRP drops to $1.33, with $3.32 million in ETF inflows still failing to reverse the downtrend; the key support to watch is $1.28
In April 2026, the XRP price pulled back to $1.33, down about 4%. Although there was capital inflow into Ripple-related products, selling pressure dominated the market, and increased trading volume signaled distribution. Declining liquidity further heightens volatility risk; watch the $1.33 support—if it breaks, prices will likely fall further. For a short-term rebound, it needs to break above $1.35; otherwise, it should remain in a weak range-bound consolidation.
GateNews12m ago
XRP Price Structure Signals More Downside — Key Levels to Watch
XRP fails to make new highs, confirming bearish market structure remains intact.
Price targets $1.13, $1.08, and potentially $0.87 support levels.
Traders should wait for confirmation instead of reacting to short-term price moves.
Short bursts of green candles can quickly shift market
CryptoNewsLand18m ago
Bitcoin is hovering around the $700,000 level; if oil prices fall below $100 or push toward $80,000
Bitcoin has recently been trading in a high-level range. The price rebounded from $67,000 to $70,900, driven by a U.S.-Iran ceasefire agreement. Market analysis suggests that weakness in oil prices—or easing inflation pressure—may support Bitcoin’s upside. If it breaks above $72,500, it could trigger short liquidations and push the price up to $80,000. However, instability in the Middle East and a rebound in oil prices could act as a drag. Volatility in the energy market will be a key factor influencing Bitcoin’s direction.
GateNews19m ago
Tom Lee: The stock market often hits bottom early in a war, bullish on Ethereum and tech stocks
Well-known analyst Tom Lee said in an interview that despite the U.S.-Iran conflict and rising oil prices, the stock market did not fall, showing that the market has strong resilience. He believes that most S&P constituents have undergone significant adjustments, that the worst-case scenario for the overall market may already be behind us, and that there is room for upside from here. He is bullish on Ethereum as well as technology, industrial, and mid- and small-cap stocks.
GateNews1h ago
Michael Saylor: Bitcoin may have already hit bottom, but quantum risks have been exaggerated
Strategy Executive Chairman Michael Saylor believes Bitcoin hit its bottom around $60,000 this February, because all forced sellers in the market have already exited. He said that the catalyst for the next bull market will be a bitcoin-based banking credit system, while he believes the threat from quantum computing is being exaggerated, and he pointed out that the technical community has enough time to deal with this threat.
MarketWhisper3h ago
Glassnode: Is the Bitcoin rebound just a dead cat bounce? Where is the key pressure level?
Glassnode reports that although the Bitcoin price rebounded to $72k due to a U.S.-Iran ceasefire, the market structure is still in a bear market. In the short term, the downside may be limited, but the $78k level faces pressure overhead. ETF capital inflows have ticked up slightly, but they have not yet fully returned; trading activity in derivatives remains sluggish, indicating insufficient market confidence. Going forward, we need to monitor changes in the futures trading and options markets.
ChainNewsAbmedia4h ago
