

Starknet is under pressure today, and the move is not coming out of nowhere. The STRK price is trading around $0.082, down on the day, and the chart reflects a market that is still trying to digest a heavy supply event while broader sentiment remains shaky.
The drop looks less like panic and more like a slow reaction to known risks finally hitting the market.
- Token Unlocks Finally Hit the Market
- Altcoins Are Still Stuck in Risk-Off Mode
- The STRK Chart Shows Weak Structure, Not Capitulation
- What’s Next for STRK?
Token Unlocks Finally Hit the Market
The biggest weight on STRK right now comes from its latest token unlock. On December 15, Starknet released around 127 million STRK into circulation, roughly 5% of the circulating supply.
Unlocks like this tend to matter, not because they surprise traders, but because they change the balance between buyers and sellers overnight.
In this case, the market simply did not have enough demand waiting. Liquidity was already thin, and once the new tokens became transferable, selling pressure picked up.
Volume actually fell after the unlock, which is a bad mix. When supply increases and trading activity drops, prices usually slide until a new balance is found. With another scheduled unlock coming in mid-January, traders are clearly cautious about stepping in too early.
Read Also: The Revenue Flippening Is Here: Solana (SOL) Set to Pass Ethereum (ETH)
Altcoins Are Still Stuck in Risk-Off Mode
Altcoins as a whole are struggling. The Fear and Greed Index is sitting deep in fear territory, and Bitcoin dominance keeps creeping higher.
That tells a simple story. Capital is moving toward safety. Institutions are still favoring Bitcoin through ETFs, while Ethereum and smaller Layer-2 tokens are being left behind. In that environment, even solid projects have a hard time attracting fresh money.
For Starknet, this means that positive developments or long-term upgrades are not enough on their own. Without broader risk appetite, most altcoins remain vulnerable to slow bleed rather than sharp reversals.
The STRK Chart Shows Weak Structure, Not Capitulation
From a technical point of view, Starknet does not look strong yet. The STRK price is still sitting below all its key moving averages, which tells the same story the chart has been telling for a while now. The trend hasn’t flipped. Sellers are still in control.
The RSI is drifting close to oversold territory, so selling does look a bit stretched. That can sometimes set the stage for a short bounce, but on its own, it doesn’t mean much. Oversold conditions can stick around longer than people expect.

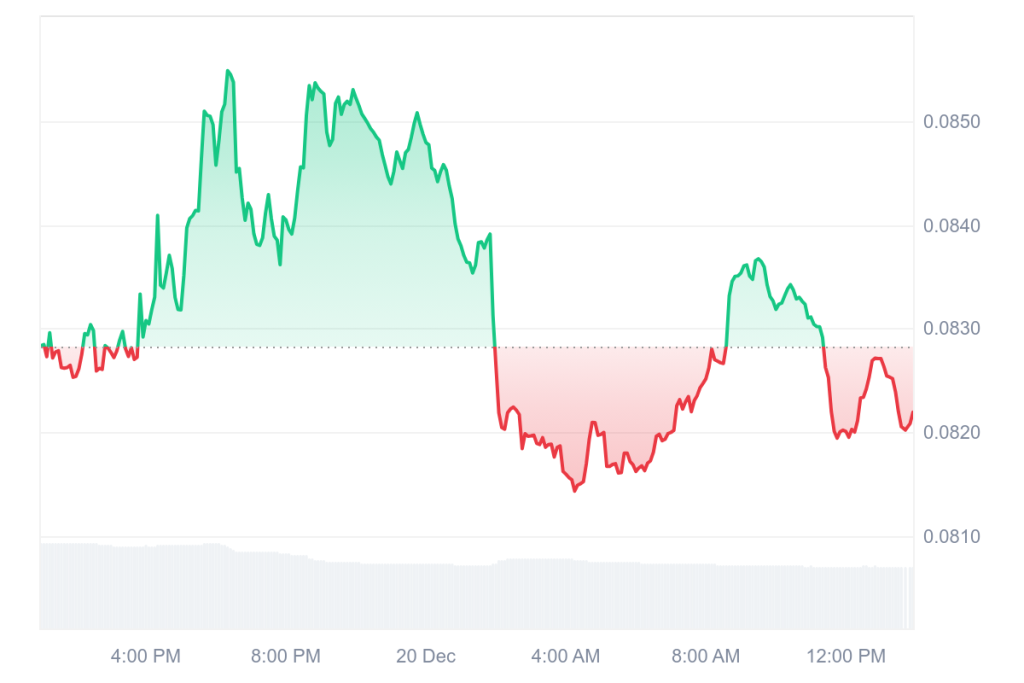
Source: CoinMarketCap/STRK
What’s missing right now is a clear bullish signal. There’s no divergence to indicate momentum is turning, and the price is still hovering uncomfortably close to the $0.079 support zone.
If that level gives way, the downside stays open. If buyers fail to defend that area, the chart leaves room for another leg lower before any meaningful recovery attempt.
What’s Next for STRK?
The STRK price current dip is not about one bad headline. It is the result of supply hitting the market, weak altcoin sentiment, and a chart that has not stabilized yet.
Network progress and ecosystem growth still matter long term, but in the short term, price action is being driven by macro flows and token mechanics.
For now, Starknet remains in a waiting phase. Buyers want confirmation. Sellers are still active. Until that changes, volatility is likely to stay pointed to the downside.
Disclaimer: The information on this page may come from third parties and does not represent the views or opinions of Gate. The content displayed on this page is for reference only and does not constitute any financial, investment, or legal advice. Gate does not guarantee the accuracy or completeness of the information and shall not be liable for any losses arising from the use of this information. Virtual asset investments carry high risks and are subject to significant price volatility. You may lose all of your invested principal. Please fully understand the relevant risks and make prudent decisions based on your own financial situation and risk tolerance. For details, please refer to
Disclaimer.
Related Articles
ETH 15-minute drop of 0.66%: short-term holders selling off in tandem with exchange net inflows amplifies the selling pressure
2026-04-12 22:00 to 22:15 (UTC), ETH showed a clear downward move in a highly liquid environment. The candlestick chart indicates a return of -0.66%, with price fluctuations ranging from 2186.76 to 2211.25 USDT, and a swing amplitude of 1.11%. Market attention rose rapidly, short-term sentiment turned cautious, and volatility intensified.
The main driving factors behind this unusual move are a sharp increase in exchange net inflows and concentrated selling by short-term holders. On-chain data shows that over the past 24 hours, net inflow of ETH into exchanges totaled 9,567.65 ETH, suggesting that a large amount of capital entered the market in the short term, potentially increasing selling pressure.
GateNews2h ago
CTSI Price Soars 17.57%: Institutional Interest Ramps Up
Amid a crypto market downturn, CTSI surged 17.57% to $0.03626 in an hour, driven by high trading volume and institutional interest in altcoins. Traders are now watching key support and resistance levels for future price movements.
Coinfomania3h ago
Bitcoin falls below 71,500 USD, U.S.-Iran talks remain deadlocked, and the Strait of Hormuz becomes the biggest point of contention
On April 11, the U.S. and Iran began 20 hours of negotiations in Pakistan. The core issue was freedom of passage through the Strait of Hormuz. After Bitcoin briefly rose to $73,800, it quickly fell back to $71,557. The U.S. side took a hardline stance, demanding that Iran open the strait, while Iran insisted that easing restrictions must wait until a comprehensive agreement is reached. The two sides have not yet reached a consensus.
動區BlockTempo7h ago
Crypto Market Maintains Steady Growth Trajectory As Top Assets Show Gains
The crypto market continues to grow, with a market cap of $2.44T and Bitcoin and Ethereum showing slight increases. Top gainers include $GPM and $BASE. Meanwhile, DeFi TVL declined, NFT sales rose, and notable developments include a trader's significant loss and a push for regulatory clarity in Congress.
BlockChainReporter9h ago
BTC 15-minute chart slightly down 0.57%: leveraged long positions passively cut risk and macro sentiment disturbances drive volatility
2026-04-12 12:45 to 13:00 (UTC), the BTC price range was 71081.7 to 71493.2 USDT, with an amplitude of 0.58%. Within 15 minutes, the return recorded was -0.57%. During the period of unusual activity, market volatility increased somewhat, risk sentiment warmed up, and overall attention rose; however, there was no extreme surge in volume or a sudden drop in liquidity.
The main driver behind this unusual activity is that, under the leverage structure, long positions were reduced passively. Recently, the funding rate for perpetual contracts turned from negative to positive. Leverage among longs in the market accumulated; the price dipped slightly, triggering liquidations of some leveraged long positions and sell orders for position closures, resulting in
GateNews11h ago
Analyst: Bitcoin’s current pullback is relatively mild compared with past ones, but the bottom has not been confirmed yet.
Crypto analyst Axel Adler Jr said the current Bitcoin pullback is smaller than historic bearish-market levels, but a bottom has not yet been confirmed. He believes the market is still in a mild bear phase, and that a true recovery will require patience and waiting.
GateNews12h ago
