Toncoin (TON) continues to be bleak with a fall of 8.3% over the past month. Although the selling momentum has slowed down in the last 24 hours with a slight adjustment of 0.8%, market sentiment still leans towards a negative trend. Technical indicators are signaling a high likelihood that prices will continue to adjust. The in-depth analysis below will reveal potential scenarios that may occur in the short term.
TON is at risk of losing an important support area
At the current time, TON is being traded just above an important support zone. The formation of a red candle just above this level raises concerns about the possibility of a breakdown below. Market sentiment continues to lean towards the negative, although the current price pattern — a symmetrical triangle — is generally viewed as a potential signal for a breakout in the future. However, if selling pressure continues to dominate, a negative scenario could very well occur.
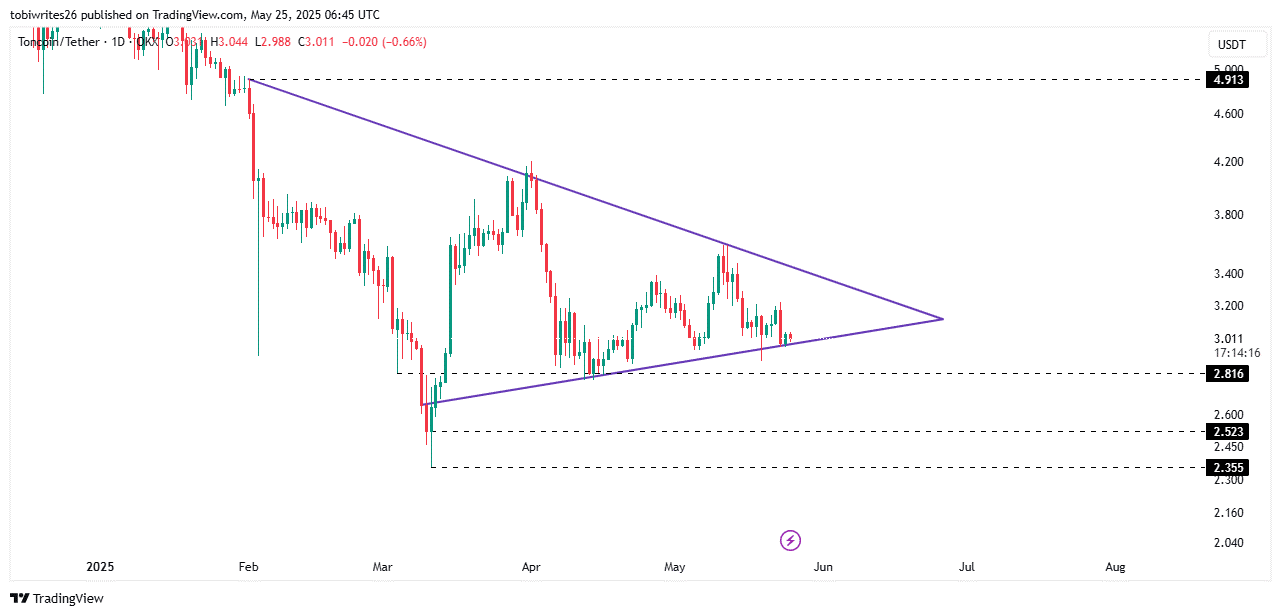 Source: TradingViewTypically, the bottom support area in a symmetrical triangle pattern acts as a springboard, pushing the asset price towards the top of the pattern at the $4.9 region. However, the appearance of a falling candle at the current support level indicates that the risk of a breakdown below is entirely possible.
If the downtrend continues, TON may test important support levels at $2.8, $2.5, and $2.3 respectively. The ability to recover at these price levels will depend on the strength of buying pressure – a key factor in determining whether TON can return to the ascending triangle structure or continue to plunge deeper.
Which path will it take?
Based on technical indicators, TON is showing a trend leaning towards negativity, with a high likelihood of continuing to move towards lower price levels on the chart.
The Relative Strength Index (RSI) – a tool for measuring momentum and determining the overbought or oversold condition of an asset – is currently at 44.21 and continues to trend downwards. This places the RSI in the weak neutral zone (from 50 to 30), which typically signals increasing selling pressure. If the downtrend continues and the RSI approaches the threshold of 30, the risk of extending the downtrend will become more pronounced.
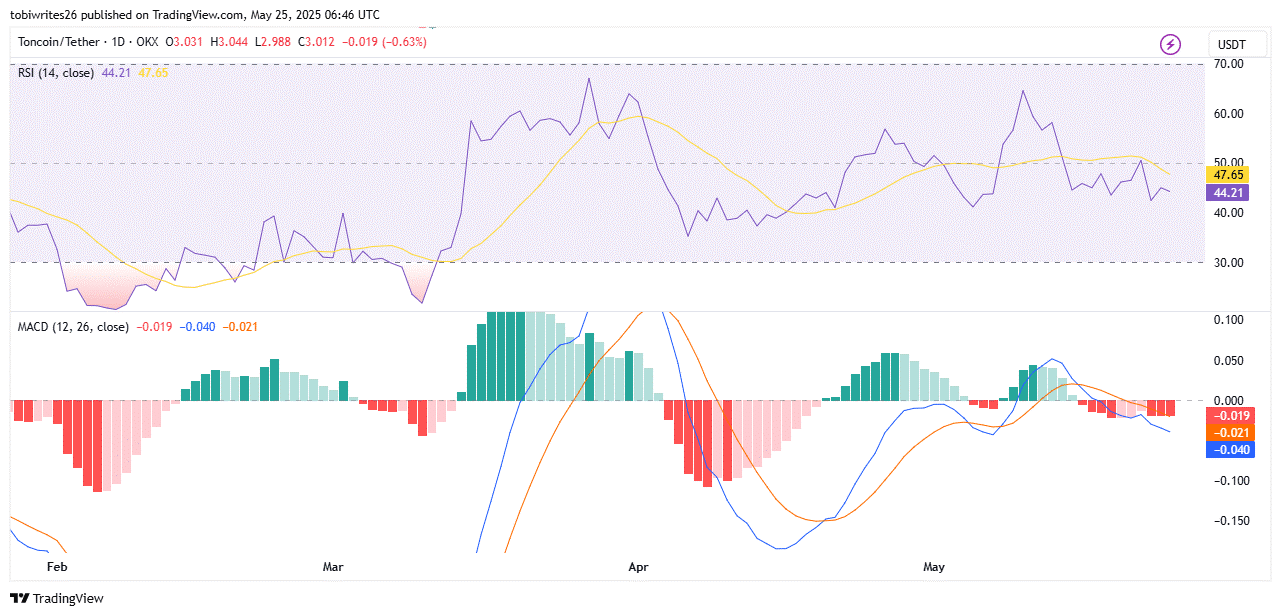 Source: TradingViewIn addition to signals from the RSI, the MACD indicator (The moving average convergence divergence)also reinforces the negative outlook for Toncoin. Currently, the MACD line has fallen to -0.040, below the signal line which is oscillating around -0.021 – a clear sign of a bearish crossover.
This intersection indicates that the downward trend is prevailing, with the selling pressure overshadowing the buying power. If a reversal signal does not appear soon, the possibility of TON forming lower lows is very noteworthy.
Users are rushing to leave
Not only do technical indicators show a negative trend, but the trading volume on DEX exchanges of Toncoin is also falling sharply. Specifically, the DEX trading volume has dropped to 3.3 million dollars – the lowest level since the beginning of the year, according to chart data.
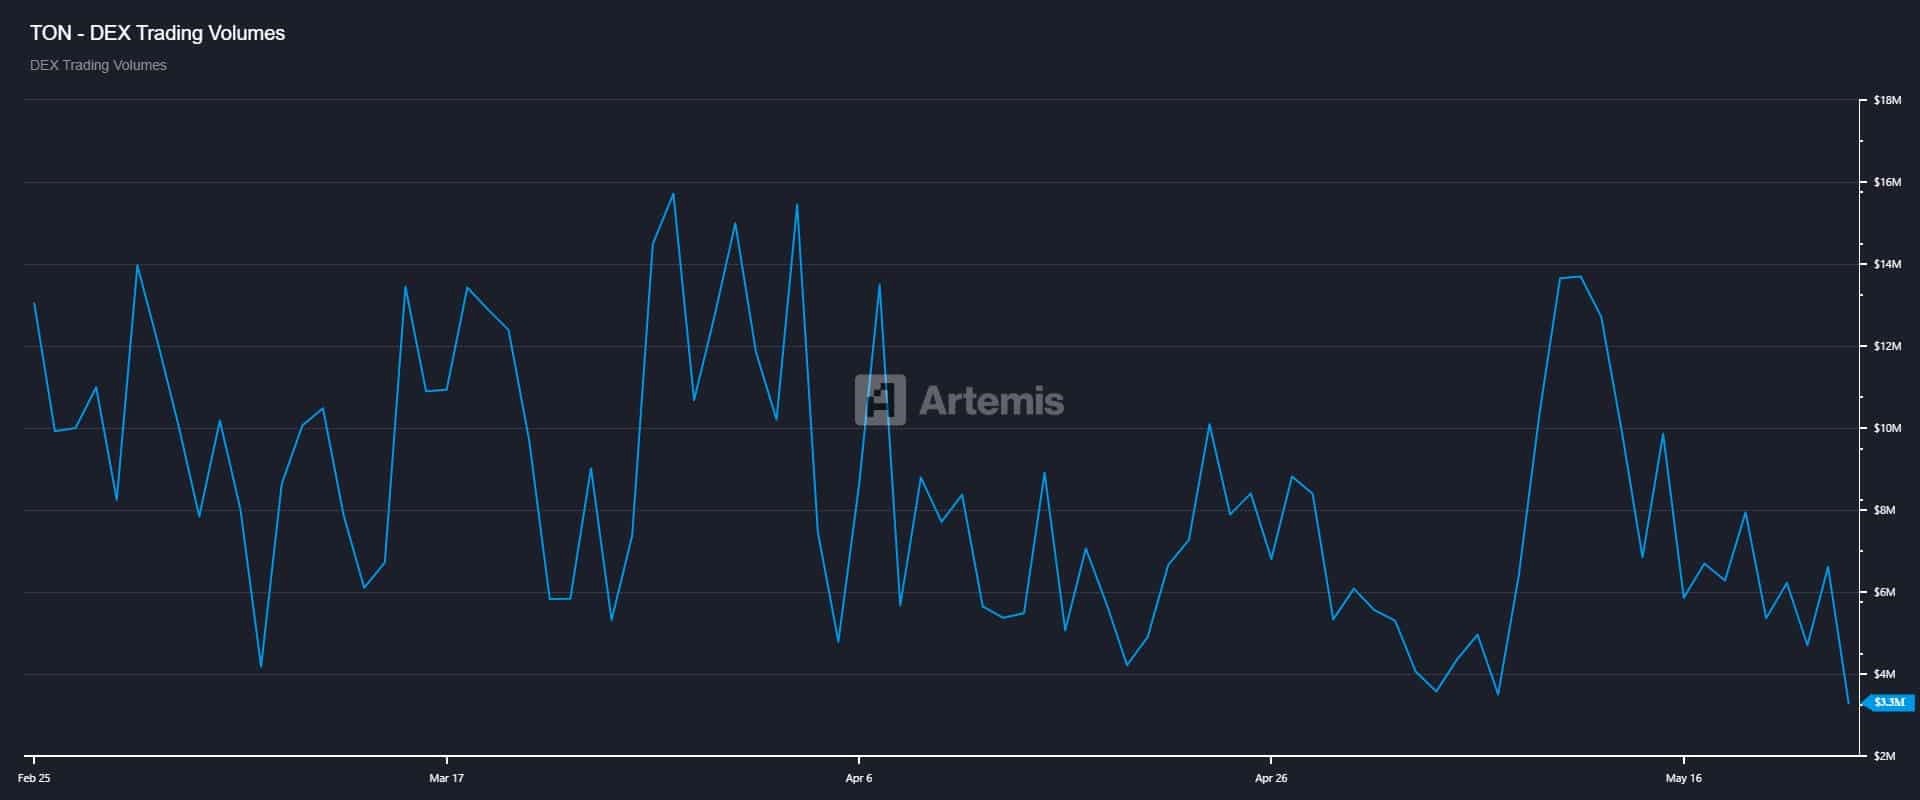 Source: ArtemisThe sharp decline in trading activity indicates that interest in the TON ecosystem is gradually fading. As the number of users decreases and liquidity becomes less efficient, investor confidence also weakens, leading to the risk of price instability.
If there is no clear recovery in on-chain demand or improvement from technical indicators, Toncoin may lose the key support zone and slide far away from the bullish triangle structure – a concerning signal for the medium-term trend.
Minh Anh
Disclaimer: The information on this page may come from third parties and does not represent the views or opinions of Gate. The content displayed on this page is for reference only and does not constitute any financial, investment, or legal advice. Gate does not guarantee the accuracy or completeness of the information and shall not be liable for any losses arising from the use of this information. Virtual asset investments carry high risks and are subject to significant price volatility. You may lose all of your invested principal. Please fully understand the relevant risks and make prudent decisions based on your own financial situation and risk tolerance. For details, please refer to
Disclaimer.
