Bitcoin (BTC) is still fluctuating below the important resistance level of $109,588 in the context of a sluggish trading market at the beginning of the week. However, analysts maintain an optimistic view on the long term trend. Keith Alan, co-founder of Material Indicators, shared on platform X that the outlook for Bitcoin remains positive as long as the price holds above the opening level of this year, around $93,500.
The attraction to Bitcoin is expected to continue increasing thanks to capital inflows from sovereign wealth funds, ETF funds, listed companies, and some governments. In the latest report, cryptocurrency fund management company Bitwise estimates that institutions could invest around 120 billion USD in Bitcoin by 2025, and this figure could soar to 300 billion USD by 2026.
Although the medium and long-term prospects are promising, the market still carries the risk of correction in the short term. If Bitcoin cannot quickly surpass the $109,588 mark, profit-taking pressure from short-term investors may increase. At that point, some altcoins may also adjust accordingly and lose part of their recent gains.
Will Bitcoin soon break through this resistance level and create momentum that triggers a new price surge for the entire market? Let’s take a look at the cryptocurrencies that are showing strong signals on the technical charts.
Technical Analysis of BTC
Bitcoin dropped below the breakout level of $109,588 on May 23, and the bears thwarted the bulls’ recovery attempt above resistance on May 24.
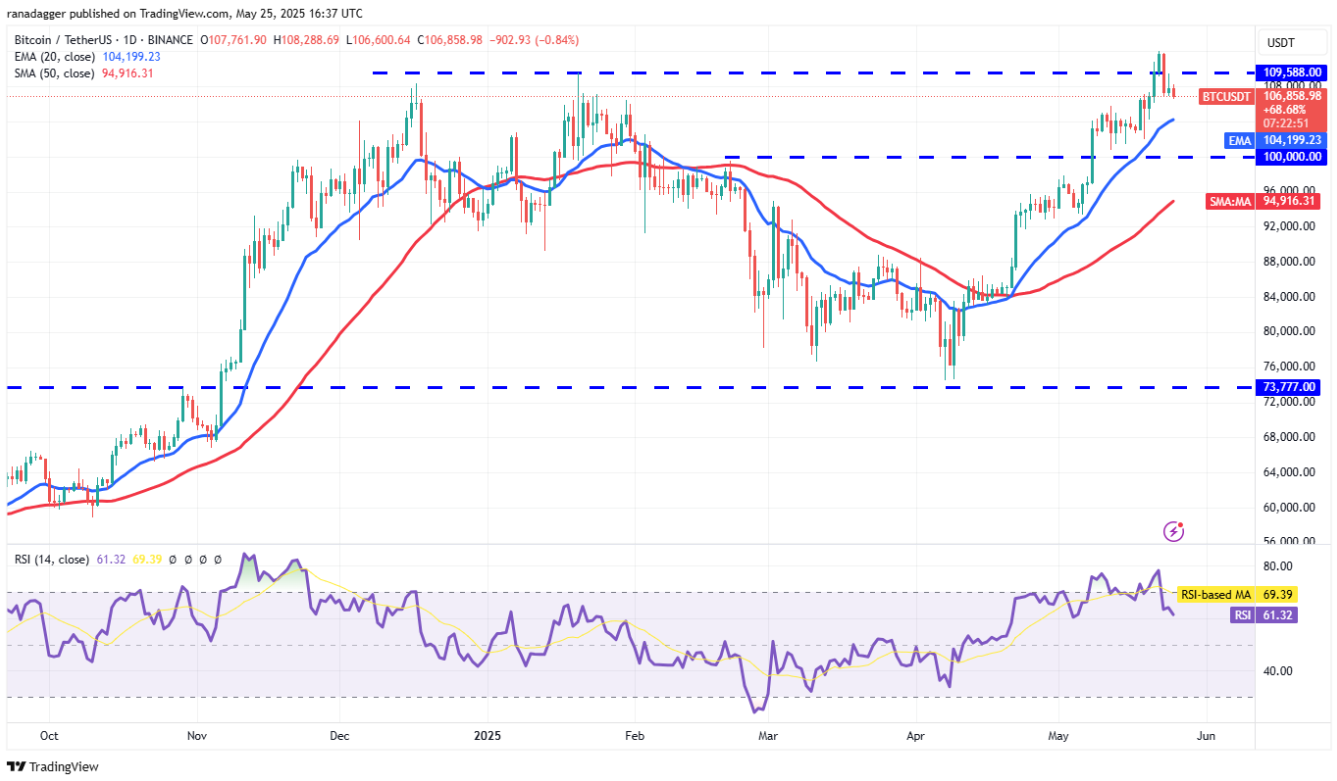 BTC/USDT daily chart | Source: TradingViewThe bulls will continue to try to push the price above the resistance zone from $109,588 to $111,980. If successful, the BTC/USDT pair may accelerate towards the target of $130,000.
The 20-day exponential moving average (EMA) at $104.199 is an important level to watch in the short term. If this support level is broken, the pair could plummet to $100,000 and then to the 50-day simple moving average (SMA) at $94,916.
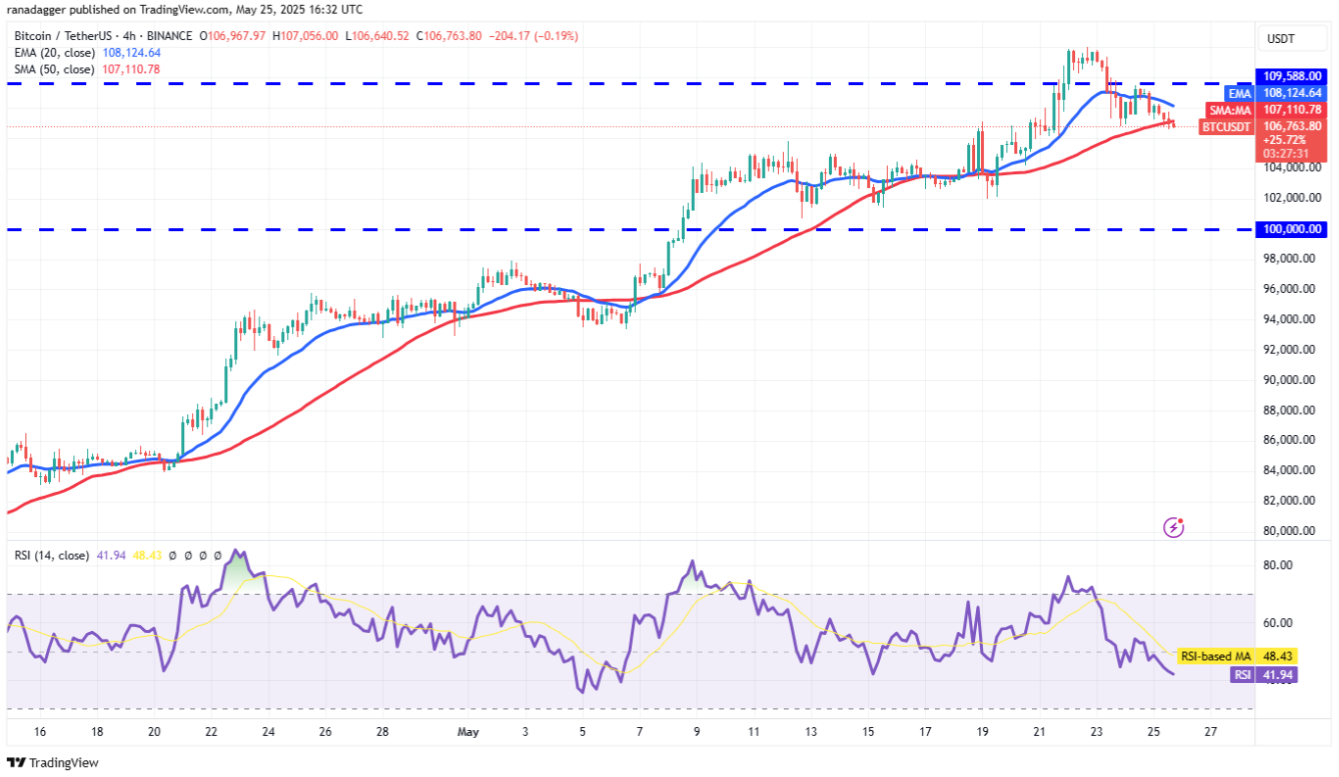 BTC/USDT 4-hour chart | Source: TradingViewCurrently, the bears have pulled the price below the 50-period SMA. The 20-period EMA has started to point downwards, while the Relative Strength Index (RSI) has fallen into the negative zone – indicating that the bears are in control. If the price stays below the 50-period SMA, this pair could drop to $102,500 and then to $100,000.
Bulls will regain control if they can push and hold the price above the resistance level of $109.588. At that point, this currency pair may test the level of $111.980. A breakout above $111.980 could open the door for the next rally up to $116.654.
HYPE Technical Analysis
Hyperliquid (HYPE) has broken through the resistance level of $35.73, indicating that the bulls are maintaining strong buying pressure.
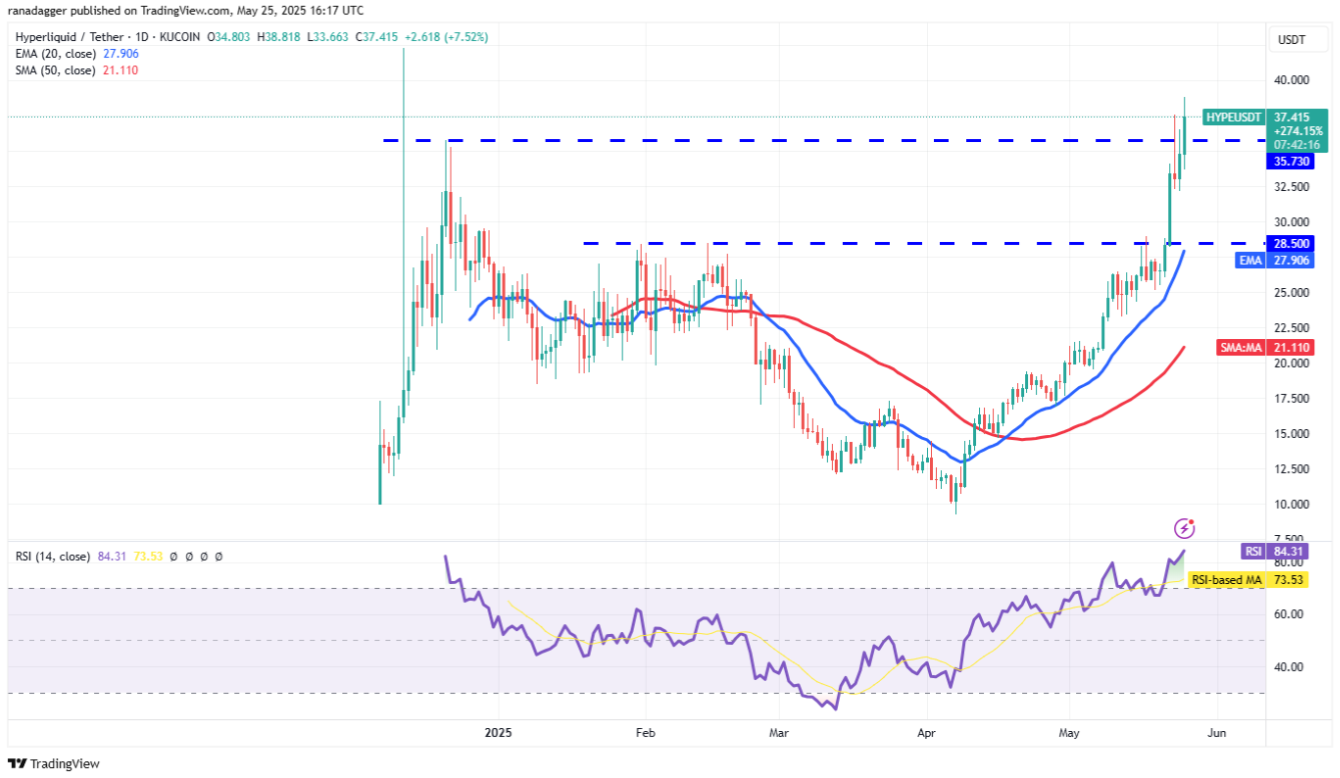 Daily HYPE/USDT Chart | Source: TradingViewIf the price holds above $35.73, the HYPE/USDT pair could accelerate and surge to $42.25. The bears will try to halt the rally at $42.25, but if the bulls gain the upper hand, the price could explode to $50.
However, the bears may have other plans. They will try to pull the price back below the breakout level of $35.73. If this happens, the pair could adjust to the support zone of $32.15, which is expected to attract buying force.
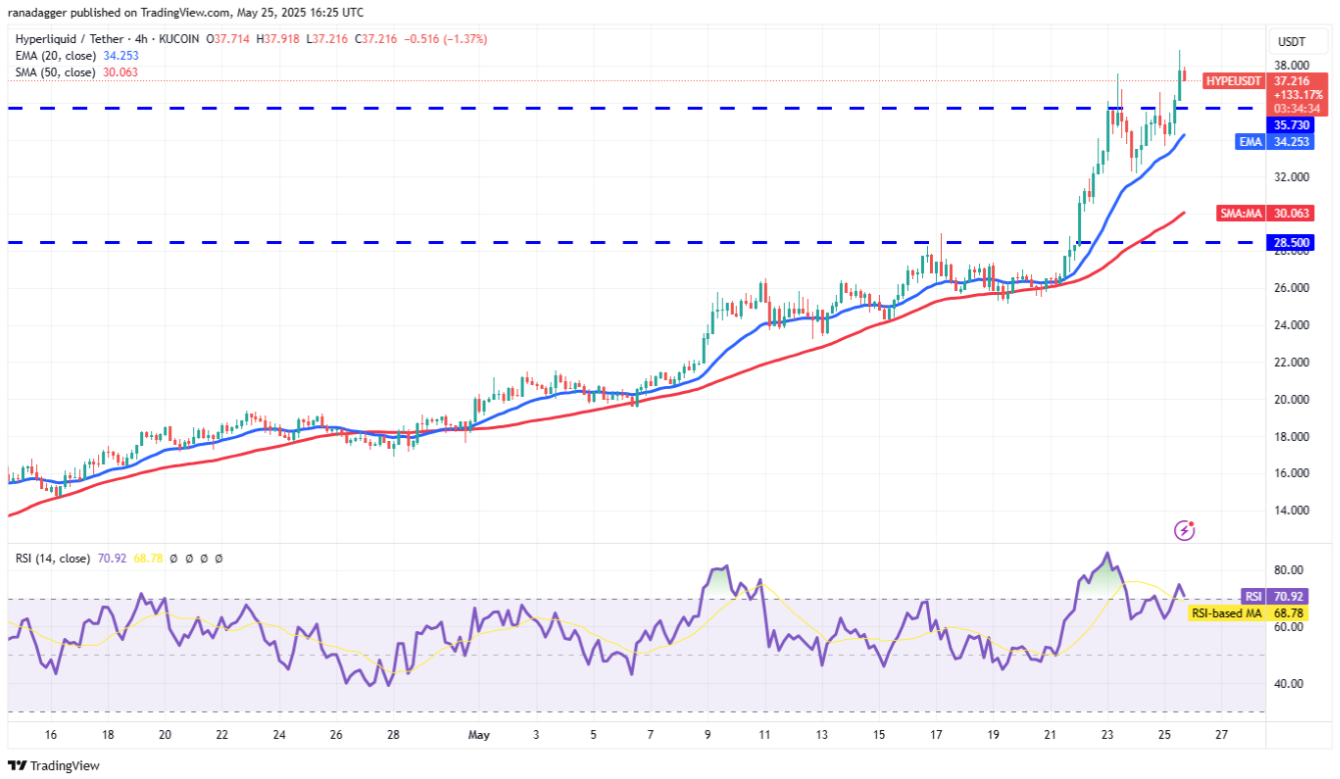 The HYPE/USDT chart on the 4-hour timeframe | Source: TradingViewThis currency pair has bounced from the 20-period EMA and broke through the upper barrier at $35.73. If the price holds above this level, it indicates that the bulls are trying to turn resistance into support. At that point, the currency pair could continue to target $42.25.
This optimistic view will be negated in the short term if the price reverses sharply and breaks below the EMA 20 line. This could trap many bullish investors, pulling the currency pair down to $32 and then to $28.50.
Technical Analysis XMR
Monero (XMR) has broken through the resistance level of $391 on May 21, indicating that the bulls are still in control of the market.
! Daily XMR/USDT Chart | Source: TradingViewThe sharp rally in the past few days has brought the RSI into the overbought zone, indicating that demand is still dominant. If the bulls hold above $412, the XMR/USDT pair could continue its uptrend towards the $456 area.
The bears will need to pull the price down below the $375 mark to weaken the upward momentum. This could lead to profit-taking pressure from short-term investors, pushing the pair down to the 20-day EMA $347. A break and close below the 20-day EMA will be a signal that the short-term trend is changing.
 XMR/USDT chart 4-hour | Source: TradingViewCurrently, the currency pair is receiving support from the 20-period EMA, indicating that the bulls are still in control. If the price rises above $412, the bullish trend may enter the next phase towards $456.
Conversely, if the price breaks and closes below the 20-period EMA line, it indicates that the bulls are offloading. At that point, the price may drop to the 50-period SMA line – where buying pressure is expected. However, a bounce from the 50 SMA may face selling pressure at the 20 EMA line. If the price turns down from the 20 EMA, the likelihood of breaking below the 50 SMA will increase, and the currency pair may plunge to the $332 area.
Technical Analysis of AAVE
Aave (AAVE) has maintained support at the breakout zone of $240 on May 23, indicating strong buying pressure at lower price levels.
! AAVE/USDT Daily Chart | Source: TradingViewThe 20-day EMA ($231) is heading upwards along with the RSI being in the overbought zone reflecting a bullish advantage. The AAVE/USDT pair may continue to rise to the $285 area, which is expected to act as strong resistance. If the buying force is strong enough to break through the $285 mark, the rally could extend to $300, and beyond $350.
Any corrective wave is expected to attract buying pressure at the 20-day EMA zone. If the price bounces back from the 20-day EMA line, the bulls will continue to make efforts to break through the resistance level above. On the contrary, if the price breaks down below this EMA line, the bears will have a chance to re-enter the game.
 AAVE/USDT 4-hour chart | Source: TradingViewCurrently, the price has adjusted to the 20-period EMA – an important technical level to watch. If the price bounces up from here, the bulls will try to push the AAVE/USDT pair above the $285 resistance. If successful, the next target will be $300.
In the reverse scenario, if the price breaks below the 20-period EMA line, the currency pair may drop to the 50-period SMA line and continue to retreat to the $240 area. A bounce from the $240 mark may face selling pressure again at the 20-period EMA line. If the price turns sharply down from this EMA line, the risk of a drop to $217 will increase.
Technical Analysis WLD
Worldcoin’s rally (WLD) is under selling pressure in the $1.65 area, but the small positive is that the bulls still maintain the price not falling below the 20-day EMA ($1.20).
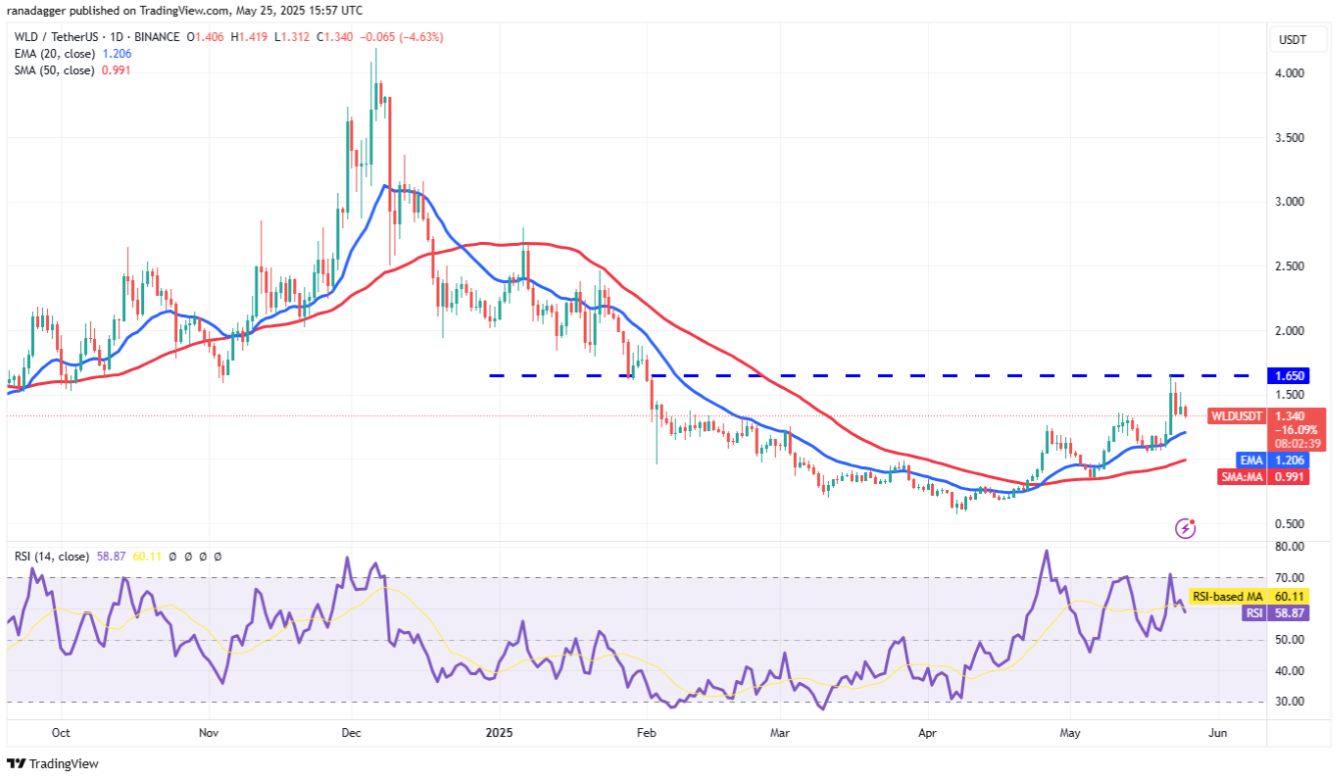 WLD/USDT Daily Chart | Source: TradingViewThe moving averages are trending upward, while the RSI indicator remains in the positive zone – this indicates that the advantage still lies with the buyers. If the price bounces from the current area or from the 20-day EMA, the bulls will continue to push the price above the resistance level of $1.65. If successful, the WLD/USDT pair could surge to $2.50. Although there is a resistance at $1.89, it is likely to be overcome.
This positive scenario will be invalidated if the price reverses and breaks below the 20-day EMA. At that point, the pair could drop to the 50-day SMA at $0.99.
 WLD/USDT chart 4-hour | Source: TradingViewCurrently, the bears have pulled the price below the 20-period EMA, indicating a potential for a deeper correction towards the 50-period SMA. The bulls may try to create a recovery from this SMA, however, they will face strong resistance at the 20-period EMA. If the price turns down from the EMA and breaks through the 50-period SMA, the WLD/USDT pair could plummet to the $1.09 area.
The first positive signal will appear when the price breaks out and closes above the downtrend line. At that point, this currency pair could rise to the $1.52 area and higher to $1.65.
SN_Nour
