Key Notes
- Bitcoin has reclaimed $100K, triggering renewed bullish signals across on-chain and technical indicators.
- All age bands are now in profit, marking a full recovery in holder profitability and signaling strong investor conviction.
- The Bull-Bear 30DMA has started to curve upward, suggesting an impending period of massive growth.
Bitcoin
BTC
$96 611
24h volatility:
2.1%
Market cap:
$1.92 T
Vol. 24h:
$29.09 B
has reclaimed the $100,000 level for the first time in months, trading at around $102,000 at the time of writing — a nearly 4% surge in the past 24 hours.
One of the most significant on-chain signals confirming market strength comes from CryptoQuant’s Bull-Bear Market Cycle Indicator, which has finally begun to flash bullish after consistently signaling bear conditions since February 24, 2024.
 CryptoQuant’s Bull-Bear Market Cycle Indicator | Source: CryptoQuant
While the coefficient of the bullish signal is still weak at 0.029, it’s the first green signal in over two months, hinting at a potential shift in momentum.
Convergence of bullish indicators
The Bull-Bear 30DMA has started to curve upward. Historically, when this shorter-term moving average crosses above the Bull-Bear 365DMA, Bitcoin has entered periods of parabolic price growth.
The crossover hasn’t happened yet, but the upward slope is now in motion.
Meanwhile, realized price metrics based on UTXO age bands reveal that 100% of all Bitcoin holders are in profit. This rare alignment occurred when Bitcoin crossed $98,138, pushing even the final lagging band (3 to 6 months) into profitability.
Over 3 million BTC have returned to profit from underwater positions, as highlighted by Glassnode, reducing the number of underwater coins from 5M to 1.9M, indicating renewed conviction from both short- and long-term holders.
Technical analysis: momentum builds for btc
Looking at the daily chart below, Bitcoin has cleanly broken above the upper Bollinger Band, now hovering around $102,747.
Price exceeding the top band often indicates overbought conditions in the short term, which can lead to temporary pullbacks, but also suggests strong momentum. The lower band sits at $87,147, providing the key support level if price corrects.
The MACD remains in bullish alignment, with the MACD line trending well above the signal line and continuing to widen as buyers continue to dominate.
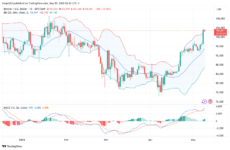 BTC 1D Chart | Source: TradingView
If Bitcoin can maintain above $102,750, the next target becomes $108,000-$110,000, followed by the all-time high range near $120,000. On the other hand, a break below the $94,947 mid-Bollinger Band or a failed hold above $100K could bring a correction toward the $87,000-$90,000 support zone.
nextDisclaimer: Coinspeaker is committed to providing unbiased and transparent reporting. This article aims to deliver accurate and timely information but should not be taken as financial or investment advice. Since market conditions can change rapidly, we encourage you to verify information on your own and consult with a professional before making any decisions based on this content.
Disclaimer: The information on this page may come from third parties and does not represent the views or opinions of Gate. The content displayed on this page is for reference only and does not constitute any financial, investment, or legal advice. Gate does not guarantee the accuracy or completeness of the information and shall not be liable for any losses arising from the use of this information. Virtual asset investments carry high risks and are subject to significant price volatility. You may lose all of your invested principal. Please fully understand the relevant risks and make prudent decisions based on your own financial situation and risk tolerance. For details, please refer to
Disclaimer.