- SUI has rallied 55% from April lows, forming a V-shaped recovery pattern with price now around $2.97, signalling a potential trend reversal.
- Technical indicators show strong bullish momentum with RSI at 69.20, positive social sentiment, and a bullish MACD crossover.
SUI token has shown strong recovery in the latest weeks, which suggests it may have reached its lowest point after enduring months of negative pressure. Various bullish signs across daily technical indicators now appear to traders and investors who monitor these indicators.
SUI experienced a 55% price surge after reaching its April low point at $1.92 to establish its current market value at $2.97. The price surge stands out because it cut through different resistance points that had previously limited market movements.
SUI price movement has developed a distinct V-shaped recovery formation, which appears on the charts. The price of SUI has demonstrated powerful buying pressure following its long-running bear market that started in January 2025 when it dropped from $5.39 to under $2
The current market uptrend displays higher highs and higher lows, which represent the essential criteria for a new uptrend development. According to CMC data, it is currently trading at $2.9607 with an intraday surge of 7%, showcasing bullishness.
What’s Next For Sui Price?
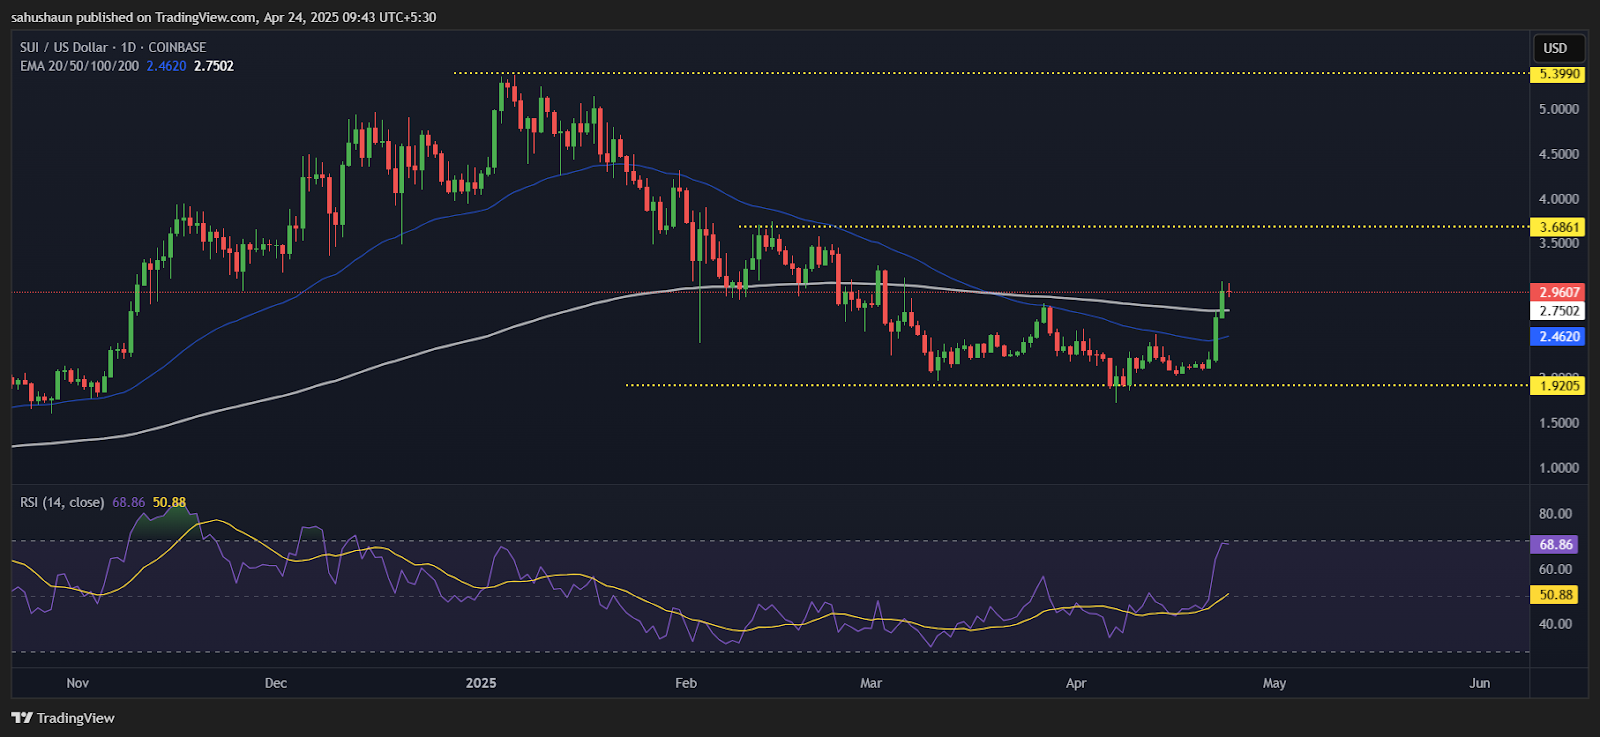 Source: TradingviewThe RSI indicator reached 69.20 on the daily technical chart, which suggests potential overbought conditions are near but have not started yet. This signals robust market momentum, which does not currently pose a threat of technical correction.
The Supertrend indicator has shifted into a bullish state because the price position exceeds the indicator line. This signals the start of fresh trend movements. Social sentiment indicators in the lower section present predominantly green bars, indicating increasing market sentiment towards SUI.
The significant previous support at $3.68 has transformed into a potential resistance barrier for investors to monitor. The $5.39 area represents the highest price reached so far during the current year.
SUI technical analysis indicates that traders may expect additional upward movement in prices, yet the price increase requires potential price stabilisation before the next price increase. New support exists at $2.42, where previous resistance had been located.
Highlighted Crypto News Today:
Bitcoin vs Gold: Will Bitcoin Overtake Gold After Surpassing Silver?
Disclaimer: The information on this page may come from third parties and does not represent the views or opinions of Gate. The content displayed on this page is for reference only and does not constitute any financial, investment, or legal advice. Gate does not guarantee the accuracy or completeness of the information and shall not be liable for any losses arising from the use of this information. Virtual asset investments carry high risks and are subject to significant price volatility. You may lose all of your invested principal. Please fully understand the relevant risks and make prudent decisions based on your own financial situation and risk tolerance. For details, please refer to
Disclaimer.
