 After two consecutive months of correction with declines of 17.39 percent in February and 2.3 percent in March, respectively, Bitcoin made a promising second quarter start as it recorded a 3.77 percent gain in April. Having fallen to a new year’s low at $74,500, BTC price is now approaching $90,000 — a signal that the recovery trend is prevailing rather than returning to the previous low.
! BTC/USDT daily chart | Source: TradingView On (HTF) large timeframe, Bitcoin marked its first breakout of 2025, rekindling hopes of a strong bull cycle for the bulls. However, some of the following potential factors could provide drag, making BTC’s rally over the next two weeks difficult and likely to remain hovering around the $90,000 mark.
Bitcoin needs real money flow from the spot market, not just leverage
Bitcoin Magazine reports signs of “cooling down” in the futures market, as the leverage ratio between BTC-USDT futures has decreased by up to 50%. This is seen as a positive long-term signal, reflecting a more cautious trading sentiment. However, at the current moment, derivative investors still play a dominant role in the market.
! btc-phuc-hoiBitcoin Net Cumulative Volume | Source: X.com Researcher Axel Adler Jr. said that on April 11, the cumulative net buying volume from active orders (net takers volume) soared to $800 million — a sign that strong buying flows are returning. This development also coincided with BTC’s impressive price rally, from $78,000 to $85,000 in just three days, reinforcing the historical pattern: when net taker volumes are high, the market often witnesses impressive breakouts.
In agreement, Maartunn – an analyst at CryptoQuant – stated that the current rally is largely driven by “leverage push,” amidst the fact that the flow of funds from retail investors and the spot market has not yet truly participated. This lack of consensus creates a certain discrepancy in the market structure.
! Bitcoin Clear Demand for 30 Days | Source: CryptoQuantThe analysis chart shows that demand for Bitcoin is gradually recovering, but has not yet reached a positive net level. Historical data shows that demand in the 30-day frame often fluctuates sideways for some time after BTC establishes a local bottom — leading to a period of sideways market movement and a marked lack of momentum.
Therefore, the likelihood of Bitcoin conquering the $90,000 mark on its very first attempt is not an easy feat – unless the market witnesses strong buying power and consensus from both spot and derivatives investors.
Large liquidation clusters in the $80,000–$90,000 range may serve as “bait” for traders
When futures traders bet in both directions, data from CoinGlass shows that large clusters of Long and Short orders are stuck with leverage in the price range from $80,000 to $90,000. Taking the current price of $85,100 as a basis, if Bitcoin rises to $90,035, the total value of Short positions at risk of being liquidated will reach up to $6.5 billion.
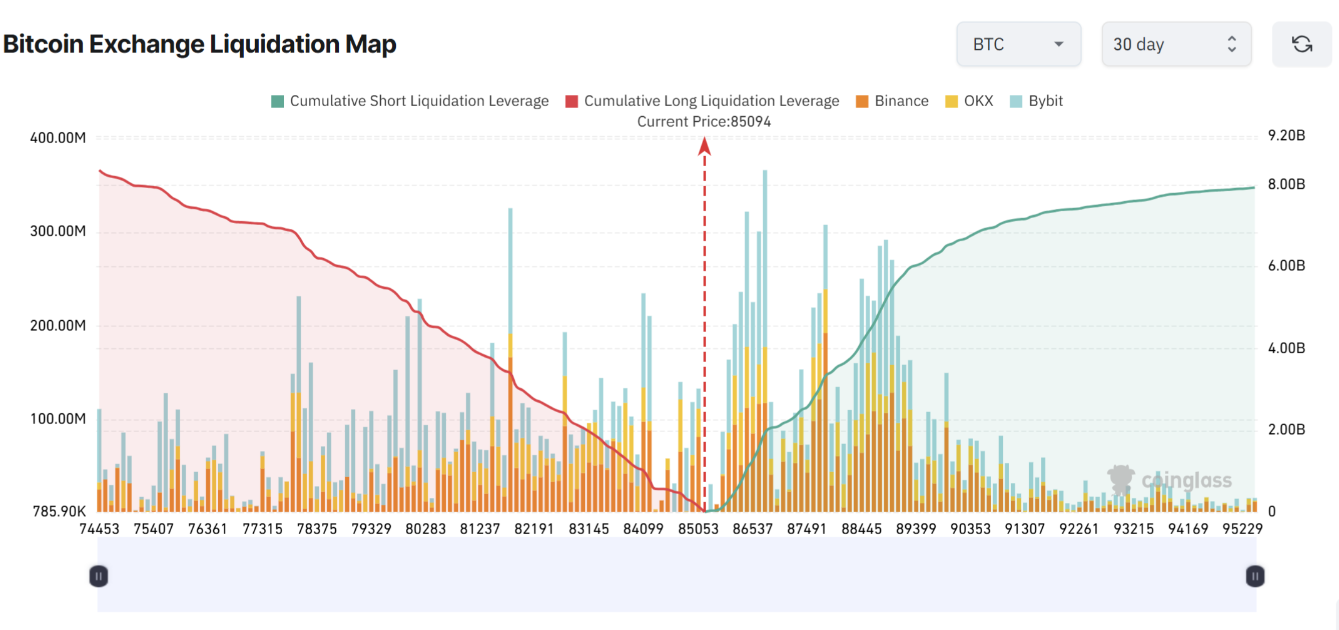 Bitcoin liquidation map across exchanges | Source: CoinGlassConversely, if the price drops to the $80,071 threshold, the market could witness approximately $4.86 billion in Long orders being wiped out. Although these liquidation clusters do not provide a definitive signal about the market’s next trend, they can trigger “squeeze” events — forcing buying or selling — causing capital flows to be caught in volatility in both directions.
With the massive amount of capital being accumulated below the $90,000 level, it cannot be ruled out that Bitcoin will successively “stop by” these liquidation clusters before establishing a clearer trend.
You can see the BTC price here.
Disclaimer:** The article is for informational purposes only, not investment advice. Investors should research carefully before making a decision. We are not responsible for your investment decisions.*
- Bitwise: Bitcoin held by listed companies up 16% in Q1
- Will the Altcoin season arrive when Bitcoin’s dominance rate stagnates?
SN_Nour
@media only screen and (min-width: 0px) and (min-height: 0px) {
div[id^=“wrapper-sevio-d89f58f5-7b63-40be-98c0-6b1fd62584fb”] {
width:320px;
height: 100px;
}
}
@media only screen and (min-width: 728px) and (min-height: 0px) {
div[id^=“wrapper-sevio-d89f58f5-7b63-40be-98c0-6b1fd62584fb”] {
width: 728px;
height: 90px;
}
}
Disclaimer: The information on this page may come from third parties and does not represent the views or opinions of Gate. The content displayed on this page is for reference only and does not constitute any financial, investment, or legal advice. Gate does not guarantee the accuracy or completeness of the information and shall not be liable for any losses arising from the use of this information. Virtual asset investments carry high risks and are subject to significant price volatility. You may lose all of your invested principal. Please fully understand the relevant risks and make prudent decisions based on your own financial situation and risk tolerance. For details, please refer to
Disclaimer.
