 Bitcoin is showing a familiar “bottom” behavior at the current price level, according to one of the most famous leading indicators.
In a post on X on April 10, John Bollinger – the creator of the Bollinger Bands volatility indicator – brought good news that could make Bitcoin bulls happy.
Bollinger Bands %b Indicator Suggests Price Recovery
According to the latest Bollinger Bands data, Bitcoin may have started to form a long-term bottom.
Analyzing the weekly time frames, Bollinger has drawn attention to one of his proprietary indicators, known as “%b”, which provides additional clues about market trend reversals.
The %b indicator measures the closing price of an asset relative to the position of the Bollinger bands, using the standard deviation around the simple moving average (SMA) for a 20-period.
One of the signals from this indicator is the “W” bottom pattern, where the first bottom is below 0 and then there is a higher bottom - this may currently be happening with BTC.
Bollinger commented:
“The classic W bottom pattern of Bollinger Bands is forming on BTC. Further confirmation is still needed.”
 BTC Chart 1 Week and Bollinger Band Data | Source: John BollingerOn both the weekly and daily time frames, Bollinger Bands indicate that no trend change has occurred.
Data from TradingView shows that the daily chart is still moving along the lower band, with the SMA in the middle acting as a resistance level.
 BTC chart for 1 week and Bollinger Bands data | Source: TradingViewTransitioning to the stock market where BTC increasingly has a close correlation, Jurrien Timmer – the global macro director at Fidelity Investments has reached a similar conclusion.
“When reviewing the Bollinger Bands, we have moved from 2 standard deviations above the trend, back to the trend, and now we are almost touching 2 standard deviations below the trend. Once again, the situation is oversold, but not to an extreme level in history,” he said about the S&P 500 index on April 9.
Bitcoin may bounce back after Nasdaq falls 10%
The price bottom targets for Bitcoin are increasingly revolving around the $70,000 mark. This level is significant for various reasons, including its role as a psychological threshold and also as a liquidity attracting zone.
Network economist Timothy Peterson – who has the “Lowest Price Forward” indicator that once suggested a 95% chance that the $69,000 level would hold as support – currently believes that Bitcoin will only reverse after the stock market finds its own bottom.
“Bitcoin is ahead of Nasdaq in this decline. As the asset considered to be at the top of the risk pyramid, I expect Nasdaq to recover first, and then it will be Bitcoin’s turn. This is something to watch. But I think NASDAQ will drop another 10%.”
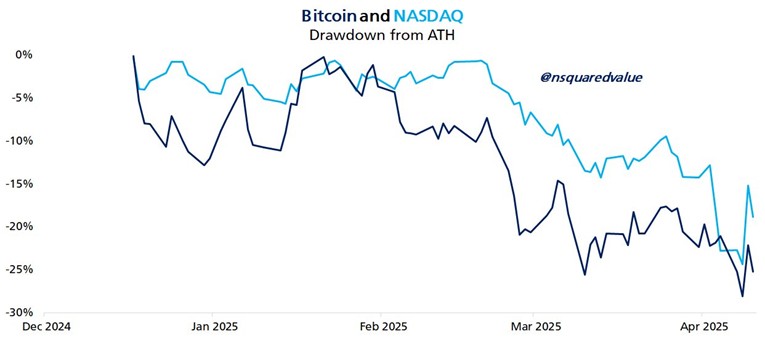 Bitcoin and Nasdaq | Source: Timothy PetersonDisclaimer: This article is for informational purposes only and does not constitute investment advice. Investors should conduct thorough research before making decisions. We are not responsible for your investment decisions
- BlackRock recorded 3 billion USD of inflows into digital assets in Q1
- 10x Research: Is Bitcoin too optimistic in the face of economic recession?
- CryptoQuant: Bitcoin could reach 84,000 dollars if bullish conditions do not improve.
Minh Anh
@media only screen and (min-width: 0px) and (min-height: 0px) {
div[id^=“wrapper-sevio-d89f58f5-7b63-40be-98c0-6b1fd62584fb”] {
width:320px;
height: 100px;
}
}
@media only screen and (min-width: 728px) and (min-height: 0px) {
div[id^=“wrapper-sevio-d89f58f5-7b63-40be-98c0-6b1fd62584fb”] {
width: 728px;
height: 90px;
}
}
Disclaimer: The information on this page may come from third parties and does not represent the views or opinions of Gate. The content displayed on this page is for reference only and does not constitute any financial, investment, or legal advice. Gate does not guarantee the accuracy or completeness of the information and shall not be liable for any losses arising from the use of this information. Virtual asset investments carry high risks and are subject to significant price volatility. You may lose all of your invested principal. Please fully understand the relevant risks and make prudent decisions based on your own financial situation and risk tolerance. For details, please refer to
Disclaimer.
