 The price of XRP has unexpectedly surged 13% in a day, surpassing the important resistance level of $2, shortly after President Donald Trump announced a 90-day pause on retaliatory tariffs – except for China, the only country still facing an additional 125% tariff as a countermeasure to Beijing’s hardline measures.
The price increase of XRP is further supported by the news that the XRP ETF fund has officially been listed on the NYSE Arca exchange, marking a significant step in the journey of integrating digital assets deeper into the traditional financial ecosystem.
However, despite the favorable macro factors and the increasingly clear support from institutional investors, the current technical indicators still signal concerning possibilities for a deep correction of XRP in the short term.
The descending triangle pattern indicates a 33% decline risk
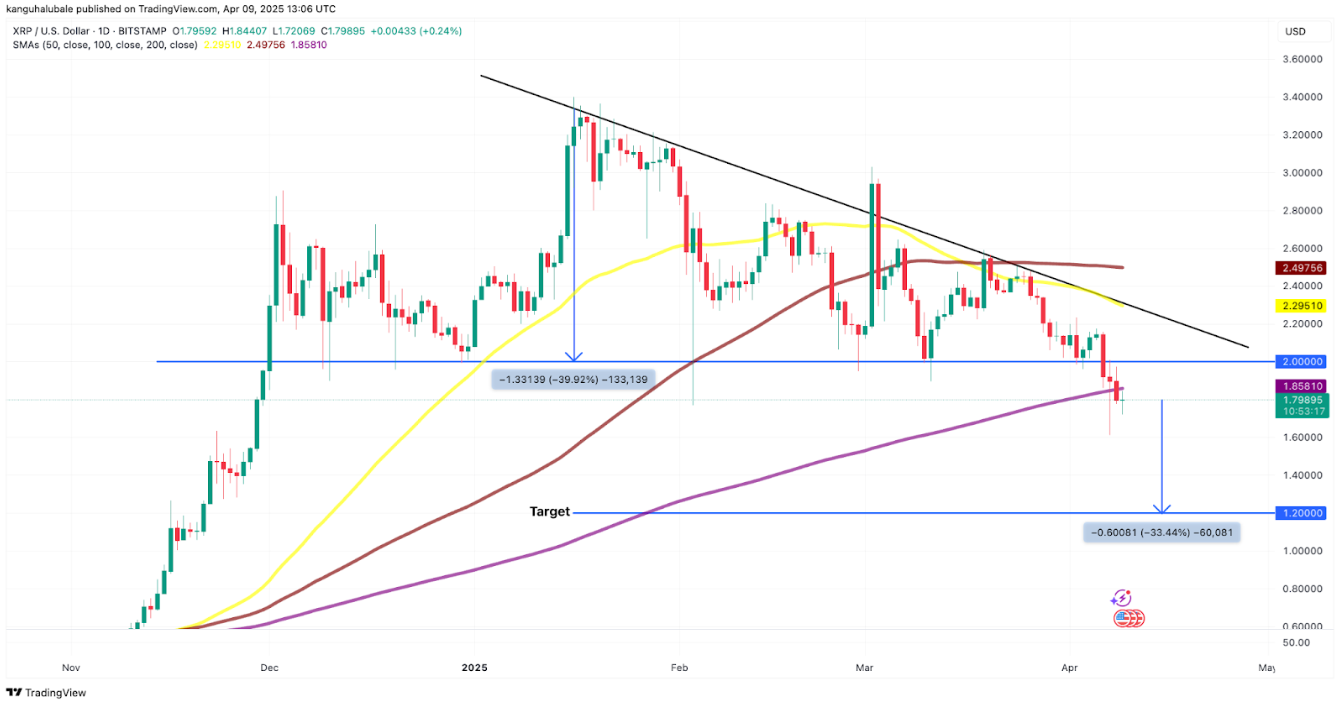
Since December 2024, the daily chart of XRP has been showing a clear formation of a descending triangle pattern – a technical structure that typically includes a horizontal support line and a downward sloping resistance line.
In the context of this model emerging after a strong price increase, many analysts view this as a potential signal for a trend reversal to bearish. According to technical analysis principles, if the price breaks through the horizontal support line, the next decline typically has an amplitude equivalent to the maximum height of the triangle.
In fact, on April 6, XRP broke through the key support level at $2, triggering warnings about the possibility of a deep correction. Accordingly, the price could slide down to the $1.20 range by the end of April – a decrease of about 33% from the current level.
 XRP/USDT daily chart | Source: TradingViewThis forecast aligns with the assessment from trader CasiTrade, who applies the Elliott Wave Theory in technical analysis “textbook standard.” According to him, XRP is likely to retreat to the $1.55 mark – the final low of the W2 corrective wave.
“The $1.81 level is currently a significant resistance that needs to be surpassed,” CasiTrade shared on platform X on April 8. “If this area cannot be maintained, a downtrend will be confirmed.”
He also pointed out that the next support level to watch is $1.71 – where the price could temporarily create a cushion before reaching the $1.55 mark, which is considered the “golden Fib zone” – a reasonable endpoint for the current correction.
 XRP/USDT daily chart | Source: TradingViewThis bearish outlook is also supported by veteran trader Peter Brandt. According to him, if the head and shoulders pattern is gradually completing on the daily chart, XRP could even plummet to the $1.07 level.
Will an ETF help XRP escape the wave of sell-offs?
Although the XRP ETF fund was officially listed on the NYSE Arca on April 8, 2025, the price of XRP has not yet escaped its fragile state, under pressure from various market factors and escalating tensions in the global trade war.
Launched in a highly volatile market, the 2x leveraged ETF – designed to amplify the daily returns of XRP – started with XRP priced around $1.71, after a 7.4% drop within just 24 hours.
On its first trading day, the XRP ETF recorded a trading volume of 5 million USD – a figure that Bloomberg’s ETF expert, Eric Balchunas, considers “noteworthy,” given the context of both the crypto market and traditional finance being shaken violently.
Although it is 200 times lower than the record set on the first day of the BlackRock-issued IBIT ETF, the opening performance of XRP is still in the top 5% of ETFs with the most impressive market debut.
 Source: Eric BalchunasIn addition to the XRP ETF fund, macro factors – especially the retaliatory tariffs announced by President Trump – continue to cast a shadow over the market, increasing volatility risk and making cryptocurrency investors more cautious.
You can see the price of XRP here.
Disclaimer: This article is for informational purposes only and is not investment advice. Investors should conduct thorough research before making decisions. We are not responsible for your investment decisions.
- Standard Chartered expects XRP to reach $12.50 by 2028, anticipating XRP ETF approval in Q3 2025.
- The SEC requests to reject the evidence presentation proposal from outsiders in the Ripple case.
SN_Nour
@media only screen and (min-width: 0px) and (min-height: 0px) {
div[id^=“wrapper-sevio-d89f58f5-7b63-40be-98c0-6b1fd62584fb”] {
width:320px;
height: 100px;
}
}
@media only screen and (min-width: 728px) and (min-height: 0px) {
div[id^=“wrapper-sevio-d89f58f5-7b63-40be-98c0-6b1fd62584fb”] {
width: 728px;
height: 90px;
}
}
Disclaimer: The information on this page may come from third parties and does not represent the views or opinions of Gate. The content displayed on this page is for reference only and does not constitute any financial, investment, or legal advice. Gate does not guarantee the accuracy or completeness of the information and shall not be liable for any losses arising from the use of this information. Virtual asset investments carry high risks and are subject to significant price volatility. You may lose all of your invested principal. Please fully understand the relevant risks and make prudent decisions based on your own financial situation and risk tolerance. For details, please refer to
Disclaimer.
