 Ripple (XRP), the fourth largest cryptocurrency by market capitalization, has dropped to a daily low of $1.64. This is also the lowest level since November 2024, losing more than 25% over the past month. The market in general is also under pressure, as concerns about the trade war between the U.S. are increasing panic sentiment, causing investors to collectively sell off stocks and risky assets.
With XRP having decreased by 16% in the past 24 hours, the big question remains: Can the price drop further down to $1, marking a 44% decline from recent highs?
Trade war raises concerns about “Black Monday”
XRP is plummeting amid increasing concerns that new tariffs from the U.S. are exacerbating the situation. President Donald Trump recently stated that he is “ready to talk,” but there are no signs that he will back down on trade policies. The unstable situation has shaken investor sentiment, leading to a stronger wave of sell-offs.
Interestingly, Google Trends shows that the search volume for the term “Black Monday” (Black Monday) is increasing rapidly. This term is often associated with past market crashes, signaling rising anxiety among investors.
The crypto market also suffered losses, dropping 11.5% of its total value, currently standing at $2.35 trillion. Meanwhile, U.S. stocks are under pressure, with S&P 500 futures down 3%, reflecting a shift away from risk assets.
As fear increases and the market becomes unstable, traders limit their participation in risky assets like XRP, causing a wave of liquidations and exacerbating the downtrend.
64 million dollars XRP liquidated
The panic mentality is increasingly evident in the futures market as data from Coinglass shows that over $1.4 billion in cryptocurrency positions have been liquidated in the past 24 hours, affecting 446,448 traders.
Of that, 64 million dollars worth of XRP was liquidated, with the majority of 56.8 million dollars coming from Long positions. This wave of sell-offs only increases the downward pressure on XRP.
In addition to the bearish sentiment, the open interest (OI) of XRP is currently below $3 billion and the funding rates (funding fees) have turned negative, indicating that more and more traders are betting on the likelihood of further declines.
Did XRP crash down to 1 dollar**?**
Currently, XRP is trading at $1.75, down 16% in the past 24 hours.
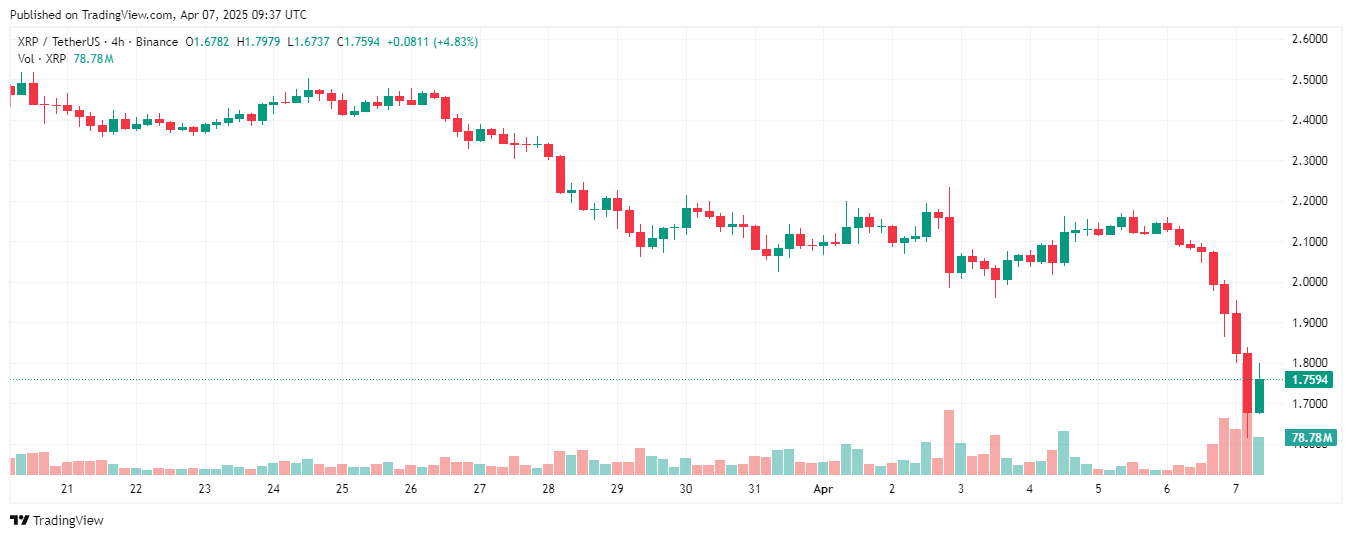 XRP 4-hour price chart | Source: TradingviewMeanwhile, technical indicators show a bearish trend as XRP slipped below the key support level of $1.8 and below the 200-day moving average, confirming the shift from a bullish region to a bearish region.
If today’s trading closes below $1.47, the price of XRP could drop further, potentially down to $1, which is a 44% decrease from the recent peak.
Disclaimer: This article is for informational purposes only and is not investment advice. Investors should do thorough research before making any decisions. We are not responsible for your investment decisions.
- Whales stir the market with 143 million USD in XRP – Is the price about to break through to $2.60?
- XRP faces the risk of a decline in April – Where does the cause come from?
- Superior privacy coin surpassing all fields of crypto by 2025
Minh Anh
@media only screen and (min-width: 0px) and (min-height: 0px) {
div[id^=“wrapper-sevio-d89f58f5-7b63-40be-98c0-6b1fd62584fb”] {
width:320px;
height: 100px;
}
}
@media only screen and (min-width: 728px) and (min-height: 0px) {
div[id^=“wrapper-sevio-d89f58f5-7b63-40be-98c0-6b1fd62584fb”] {
width: 728px;
height: 90px;
}
}
Disclaimer: The information on this page may come from third parties and does not represent the views or opinions of Gate. The content displayed on this page is for reference only and does not constitute any financial, investment, or legal advice. Gate does not guarantee the accuracy or completeness of the information and shall not be liable for any losses arising from the use of this information. Virtual asset investments carry high risks and are subject to significant price volatility. You may lose all of your invested principal. Please fully understand the relevant risks and make prudent decisions based on your own financial situation and risk tolerance. For details, please refer to
Disclaimer.
