 Last week, Bitcoin began to show early signs of decoupling from the U.S. stock market. While Bitcoin’s price remained nearly flat, the S&P 500 index plummeted with a sharp drop of up to 9%. This sell-off was triggered after U.S. President Donald Trump announced global tariffs on April 2, and tensions continued to escalate as China retaliated with a series of new tariffs on U.S. goods on April 4. Even gold – a traditional safe haven asset – could not escape the pressure, losing 1.9% of its value over the week.
On platform X, Mr. Mike Alfred – the founder of Alpine Fox – stated that the price increase cycle of gold often signals a favorable beginning for Bitcoin. In previous cycles, gold typically rises first, and then Bitcoin accelerates and outpaces it with returns of 10 times or more. He believes that this scenario will also not be an exception to that rule.
While Bitcoin’s outstanding short-term performance is a positive sign, traders should still exercise caution until there is clearer data regarding the macroeconomic context. If the U.S. stock market continues to weaken, it is possible that the cryptocurrency market will also be similarly affected.
Some altcoins are sending positive signals on the technical chart, but waiting for market sentiment to improve before taking action may be a safer option. In the event that Bitcoin successfully breaks above the nearest resistance zone, which potential coins could accelerate afterward?
Technical Analysis of PI
Pi Network (PI) has been on a strong downtrend since reaching a peak of $3 on February 26. The recovery on April 5 showed the first signs of buying strength at lower price levels.
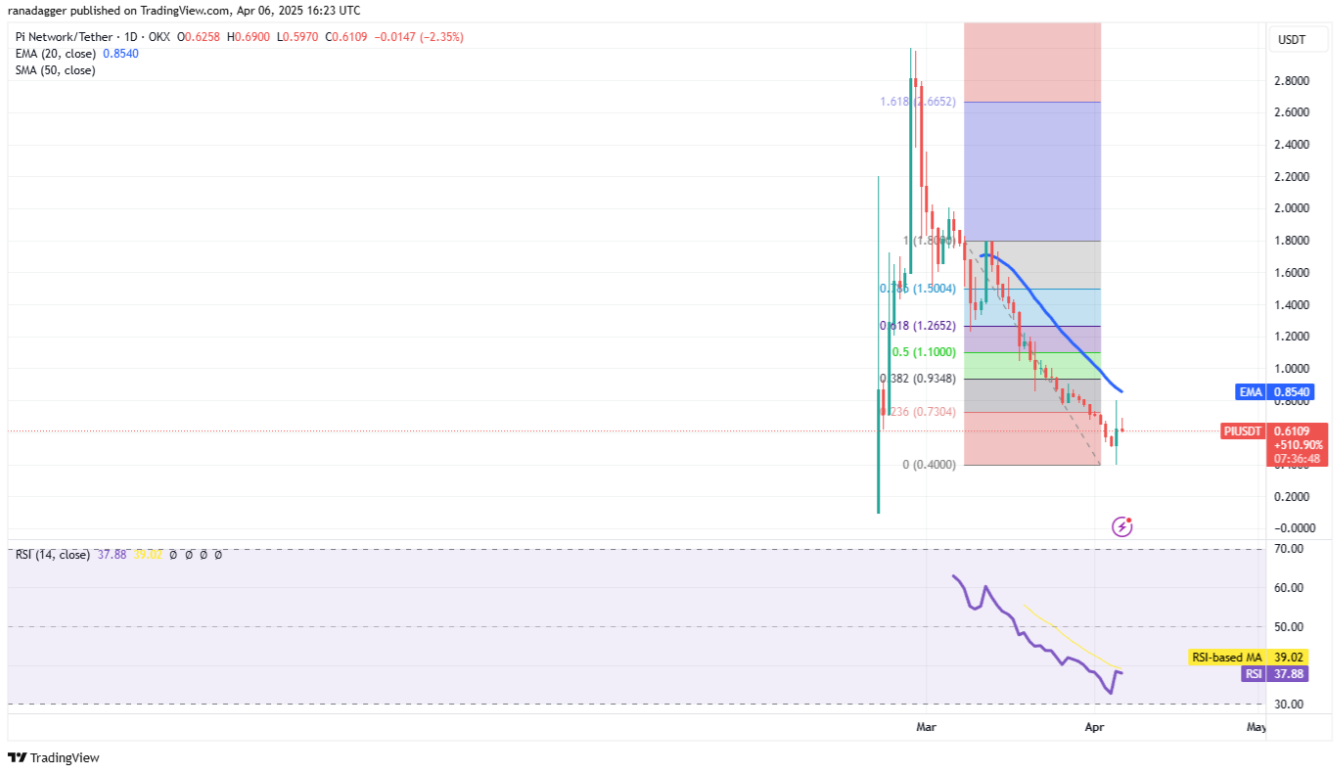 Daily chart PI/USDT | Source: TradingViewAny recovery may face selling pressure at the 20-day EMA ($0.85, which is currently an important short-term resistance level to watch. If the PI/USDT pair does not drop significantly below the 20-day EMA, this indicates that the bulls are maintaining their position. In that case, the door to a breakout above the 20-day EMA will open. Subsequently, the pair could rise to the 50% Fibonacci retracement level at $1.10, and then to the 61.8% level at $1.26.
The $0.40 level is an important support area on the downside. If the price breaks and closes below this level, the currency pair could plummet to $0.10.
![])https://img.gateio.im/social/moments-6363794e2f262acf9f5cc01782070156(PI/USDT chart 4-hour | Source: TradingViewOn the 4-hour chart, the bears are defending the simple moving average )SMA( 50, but the positive point is that the bulls are trying to keep the price above the EMA 20. If the price bounces back from the EMA 20, the bulls may attempt to push the pair above $0.80. If successful, the PI/USDT pair could aim for $1.20.
On the contrary, if the price breaks and closes below the EMA 20, it indicates that the bears are still maintaining pressure. The downtrend could accelerate if the price breaks through the $0.54 mark, and at that point, the pair may return to test the important support at $0.40.
OKB Technical Analysis
OKB surged on April 4 and closed above the moving averages, indicating that the bulls are trying to get back in the game.
![])https://img.gateio.im/social/moments-babc33038a7d3e81db5dae9fa708b836(OKB/USDT Daily Chart | Source: TradingViewThe uptrend continues, and the bulls have pushed the price above the short-term resistance at $54 on April 6. The OKB/USDT pair may advance towards the resistance line of the descending channel, where selling pressure is likely to emerge. If the price sharply reverses and breaks below the $54 level, the pair may continue to fluctuate within the channel for a few more days.
Conversely, if the bulls do not lose too much position at the resistance line, the likelihood of breaking out above the channel will increase. At that point, the currency pair may climb to $64 and then to $68.
![])https://img.gateio.im/social/moments-67c10af2369fe7ef3a6102bdbeeeae14(OKB/USDT chart on 4-hour timeframe | Source: TradingViewThe pair will complete an inverted head and shoulders pattern if it breaks out and closes above the neckline. The upward momentum may face pressure at the resistance line, but if the bulls hold the neckline as a support level, the likelihood of breaking the resistance line will be reinforced. If that occurs, this pair could begin its journey towards the model’s target at $70.
The sellers will have to fiercely defend the neckline and quickly pull the price below the EMA 20 to prevent a price surge. After that, this currency pair may drop to the SMA 50 and further down to $45.
Technical analysis of GT
Gate Token )GT( has found support at the 50-day simple moving average SMA )$22,05( over the past few days - this is an important level to watch.
![])https://img.gateio.im/social/moments-0afa3e61876d88c637334b4309ac8439(GT/USDT daily chart | Source: TradingViewThe moving averages are flat and the RSI is just below the neutral threshold, indicating that neither the bulls nor the bears currently have a clear advantage. If the price breaks above and closes over $23.18, the momentum could push the price up to $24. This will be a key resistance level that the bears will attempt to defend, as a break above it could lead the GT/USDT pair to surge up to $26.
However, this positive outlook will be invalidated in the short term if the price breaks and stays below the 50-day SMA line. At that point, this currency pair could slide to $21.28 and then to $20.79.
![])https://img.gateio.im/social/moments-5c8ce5cf00326e963b58288e35af988b(The GT/USDT chart on the 4-hour timeframe | Source: TradingViewOn the chart, the price has reversed and decreased from the resistance line of the descending channel pattern, indicating strong selling pressure as the price recovered. The price breaking through the moving averages also suggests that the currency pair is likely to fluctuate within this price channel for a while longer.
The bulls will regain an advantage if the price rises and closes above the resistance line of the channel. This move would indicate that the correction phase may have ended. At that point, the GT/USDT pair could rise to $23.18 and then continue to $24.
Technical Analysis of ATOM
Cosmos )ATOM( is attempting to form a bottom, but has faced selling pressure in the $5.15 region. A small positive signal for the bulls is that they have not yet let the price fall below the moving averages.
![])https://img.gateio.im/social/moments-a7912296b4246163027f9014b6b0aa8c(ATOM/USDT daily chart | Source: TradingViewIf the price bounces strongly from the moving averages, it will indicate buying strength when the price drops. This scenario will reinforce the outlook for a breakout at the resistance level of $5.15. If that happens, the ATOM/USDT pair could surge to $6.50 and then to $7.17.
Conversely, if the price breaks and closes below the moving averages, it indicates the possibility of forming a consolidation zone in the short term. The currency pair could fluctuate in the range of $5.15 to $4.15 for a while. The bears will regain control if the price falls below the $4.15 mark.
![])https://img.gateio.im/social/moments-bac6614bfaedd07aea89d56673445ace(ATOM/USDT 4-hour chart | Source: TradingViewOn the 4-hour chart, bulls and bears are fiercely battling around the EMA 20 line. If the price maintains below the EMA 20 line, the currency pair may drop to the SMA 50 line and then to the $4.15 mark. Bulls are expected to defend strongly at the $4.15 zone.
On the contrary, if the price holds above the 20-day EMA, it will indicate strong buying demand at lower levels. At that point, the bulls will continue to try to push the price up to $5.15. If this resistance level is broken and closes above it, a new uptrend may begin.
You can check the coin price here.
Disclaimer: This article is for informational purposes only and is not investment advice. Investors should do thorough research before making decisions. We are not responsible for your investment decisions.
- CEO CryptoQuant: Bitcoin has entered a downtrend phase.
- Bitcoin price drops to $77,000 as stocks may repeat the Black Monday of 1987
SN_Nour
@media only screen and )min-width: 0px( and )min-height: 0px( {
div[id^=“wrapper-sevio-d89f58f5-7b63-40be-98c0-6b1fd62584fb”] {
width:320px;
height: 100px;
}
}
@media only screen and )min-width: 728px( and )min-height: 0px( {
div[id^=“wrapper-sevio-d89f58f5-7b63-40be-98c0-6b1fd62584fb”] {
width: 728px;
height: 90px;
}
}
