 Celestia (TIA) has recently witnessed a significant decline, losing nearly 30% of its value in the past two weeks. The main reason is believed to be the general downward trend of the market, causing investors to fall into a state of panic.
As a result, many investors holding TIA have chosen to withdraw their funds, further increasing the downward pressure on this coin.
Celestia Holder chooses to withdraw
The Chaikin Money Flow indicator (CMF) has indicated a strong capital outflow from Celestia, marking the largest sell-off since the beginning of 2025. This reflects the growing concerns among investors as the value of this coin has decreased by up to 30%.
However, despite the negative sentiment, the CMF has recently shown positive signs, indicating that some new investors are beginning to recognize opportunities from the low price levels. This influx of capital may play a crucial role in stabilizing prices and creating a solid foundation for the upcoming recovery.
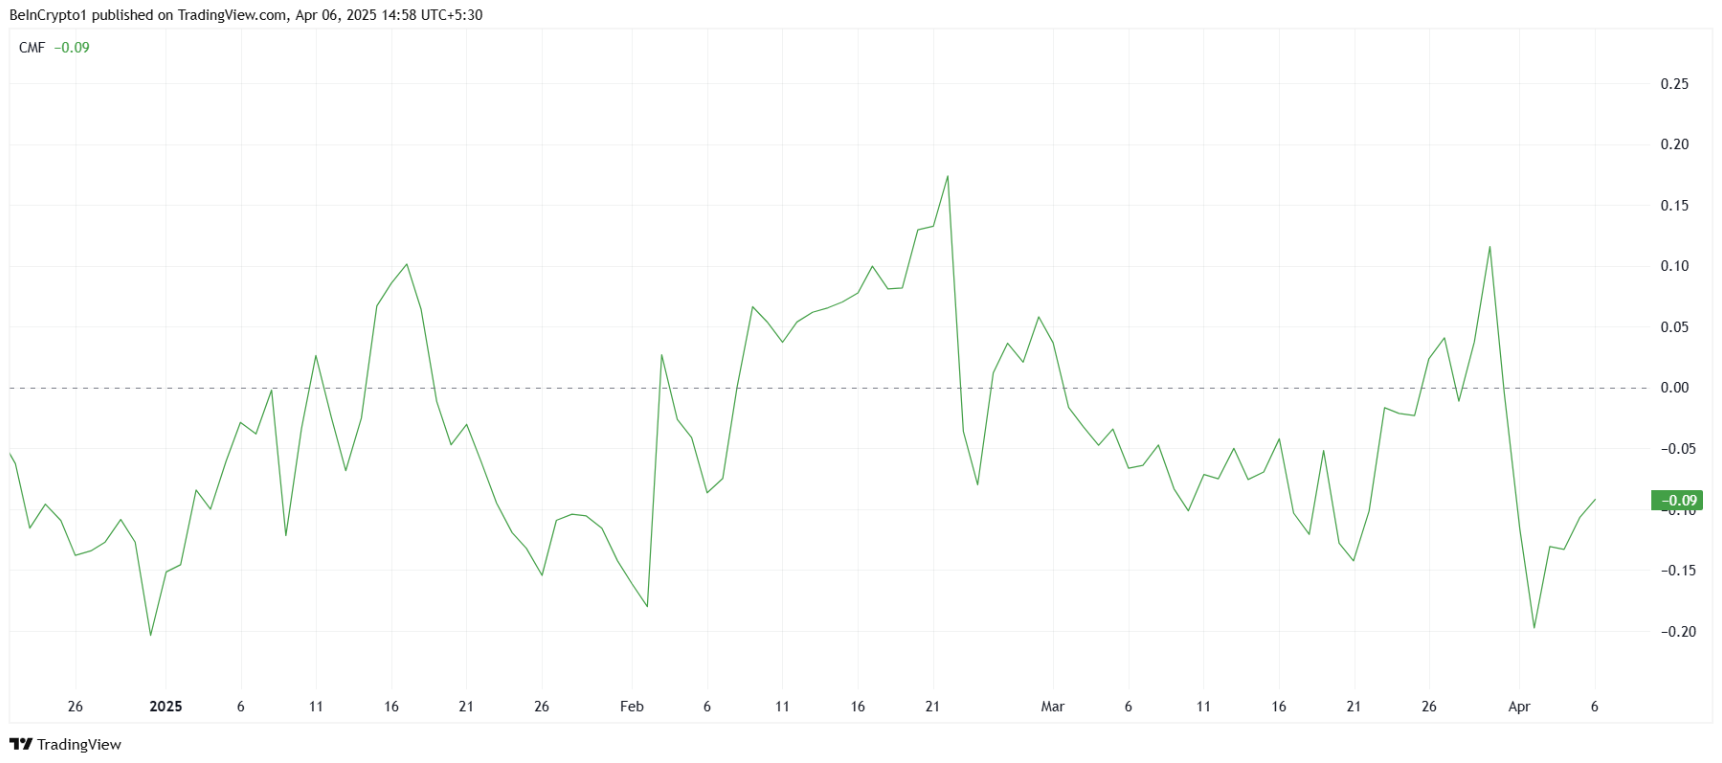 Chaikin Money Flow indicator (CMF) of TIA | Source: TradingView## RSI indicator of Celestia
The Relative Strength Index (RSI) of Celestia is currently reflecting a downward trend, as it remains below the neutral level of 50 and approaches the oversold threshold of 30. History shows that when the RSI reaches this level, it is often a signal for a potential reversal, as selling pressure weakens and the accumulation process begins.
 The RSI indicator of TIA | Source: TradingViewIf the RSI continues to drop below 30, this could trigger a buying wave, as traders will see this low price level as an opportunity to enter the market.
The current situation of the RSI indicates that although the bearish momentum is still strong, reversal signals are gradually being formed. If selling pressure eases and buyers return, the price of Celestia could find support and initiate a new upward trend.
TIA may be heading towards recovery
Currently, the price of Celestia is at $2.62, recording a decline of nearly 30% over the past two weeks. This coin is still maintaining its value above the important support level of $2.53, a support level that, if held, could create an opportunity for recovery, especially as the RSI indicator touches the oversold zone and market sentiment shows signs of improvement.
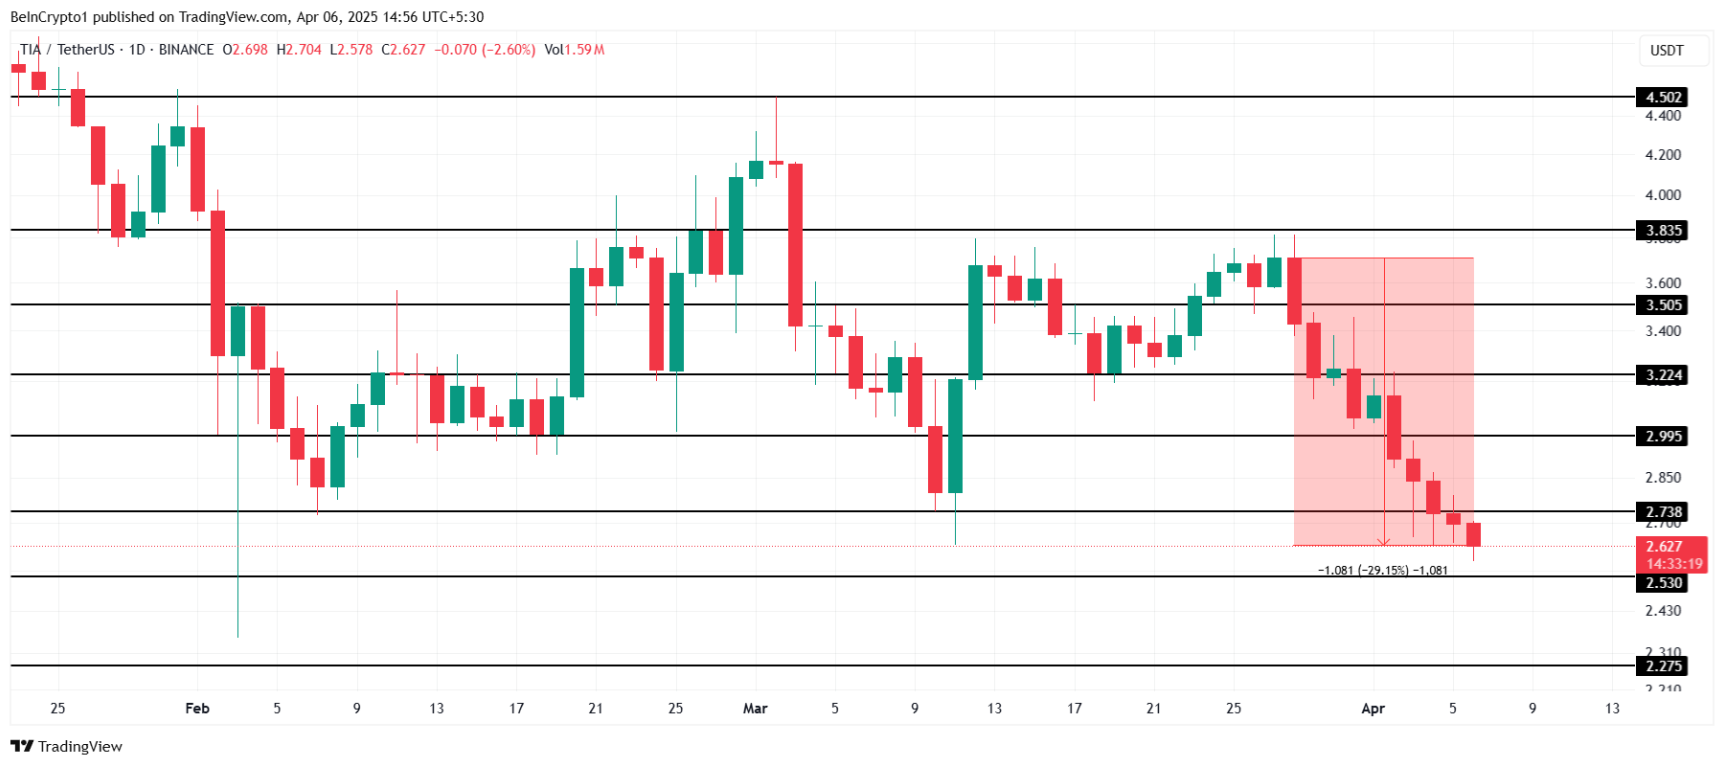 TIA/USDT daily chart | Source: TradingViewNew capital from investors can play an important role in driving the value of Celestia, creating momentum for the price to rise.
If the support level of $2.53 is successfully defended, Celestia could easily surpass the level of $2.73 and head towards $2.99, signaling the beginning of a strong recovery. This not only sets the stage for immediate growth but could also lay the groundwork for subsequent price increases as the market shows signs of recovery.
On the contrary, if Celestia cannot maintain the support level of $2.53, the risk of a drop to $2.27 will be present. This could weaken the bullish outlook, prolong the downtrend, and increase losses for investors.
@media only screen and (min-width: 0px) and (min-height: 0px) {
div[id^=“wrapper-sevio-d89f58f5-7b63-40be-98c0-6b1fd62584fb”] {
width:320px;
height: 100px;
}
}
@media only screen and (min-width: 728px) and (min-height: 0px) {
div[id^=“wrapper-sevio-d89f58f5-7b63-40be-98c0-6b1fd62584fb”] {
width: 728px;
height: 90px;
}
}
Disclaimer: The information on this page may come from third parties and does not represent the views or opinions of Gate. The content displayed on this page is for reference only and does not constitute any financial, investment, or legal advice. Gate does not guarantee the accuracy or completeness of the information and shall not be liable for any losses arising from the use of this information. Virtual asset investments carry high risks and are subject to significant price volatility. You may lose all of your invested principal. Please fully understand the relevant risks and make prudent decisions based on your own financial situation and risk tolerance. For details, please refer to
Disclaimer.
