 Bitcoin (BTC) continues to hover in a state of uncertainty as both whale activity and technical indicators suggest that the market lacks clear decisiveness. Large investors have remained silent for over a week, with the number of whale wallets holding between 1,000 and 10,000 BTC remaining stable at 1,991 since March 24.
Meanwhile, technical indicators such as Ichimoku Cloud and the exponential moving average (EMA) are giving mixed signals, reflecting hesitation from both bulls and bears. As BTC trades near important support and resistance levels, the coming days may play a decisive role in whether April will witness a breakout or a deeper correction.
Bitcoin whales are no longer accumulating
The number of Bitcoin whales — wallets holding between 1,000 and 10,000 BTC — currently stands at 1,991, a notable figure that has remained almost unchanged since March 24.
This stability indicates that large investors are maintaining a cautious stance: they are not rushing to accumulate more BTC, but there are also no signs of them offloading. With their massive holdings, even a small shift in the behavior of this group could create a strong ripple effect in the market.
The special thing is that the “wait-and-see” attitude of the whales occurs in the context of the cryptocurrency market in general experiencing continuous fluctuations. This further highlights their guiding role in shaping price trends.
 The amount of BTC held by whales | Source: SantimentMonitoring whale activity is a key factor in assessing market sentiment. Their quiet accumulation of BTC is often seen as an indicator of confidence in future price increases. Conversely, large-scale selling can be an early warning signal for downward pressure.
The fact that the number of whales has not fluctuated over the past 11 days can be understood as a “pressure build-up” phase — when institutional investors are temporarily standing aside to observe further signals from the macro environment or the internal developments of the market before taking action.
From this, it can be inferred that the current price of BTC is considered reasonable by large investors, and in the short term, the price is likely to continue fluctuating within a narrow range before a clear breakout occurs in a specific direction.
The Ichimoku Cloud of BTC shows a mixed picture
The current Ichimoku Cloud structure of Bitcoin reflects a market in a state of indecision, with a trend leaning towards caution and lack of decisiveness.
Recently, the price of BTC has slipped below the red baseline (Kijun-sen), and although there was a brief recovery that brought the price back into the cloud, the upward momentum was quickly rejected, causing the price to fall back down. This is a sign that buying power is still weak and the upward trend lacks clear momentum.
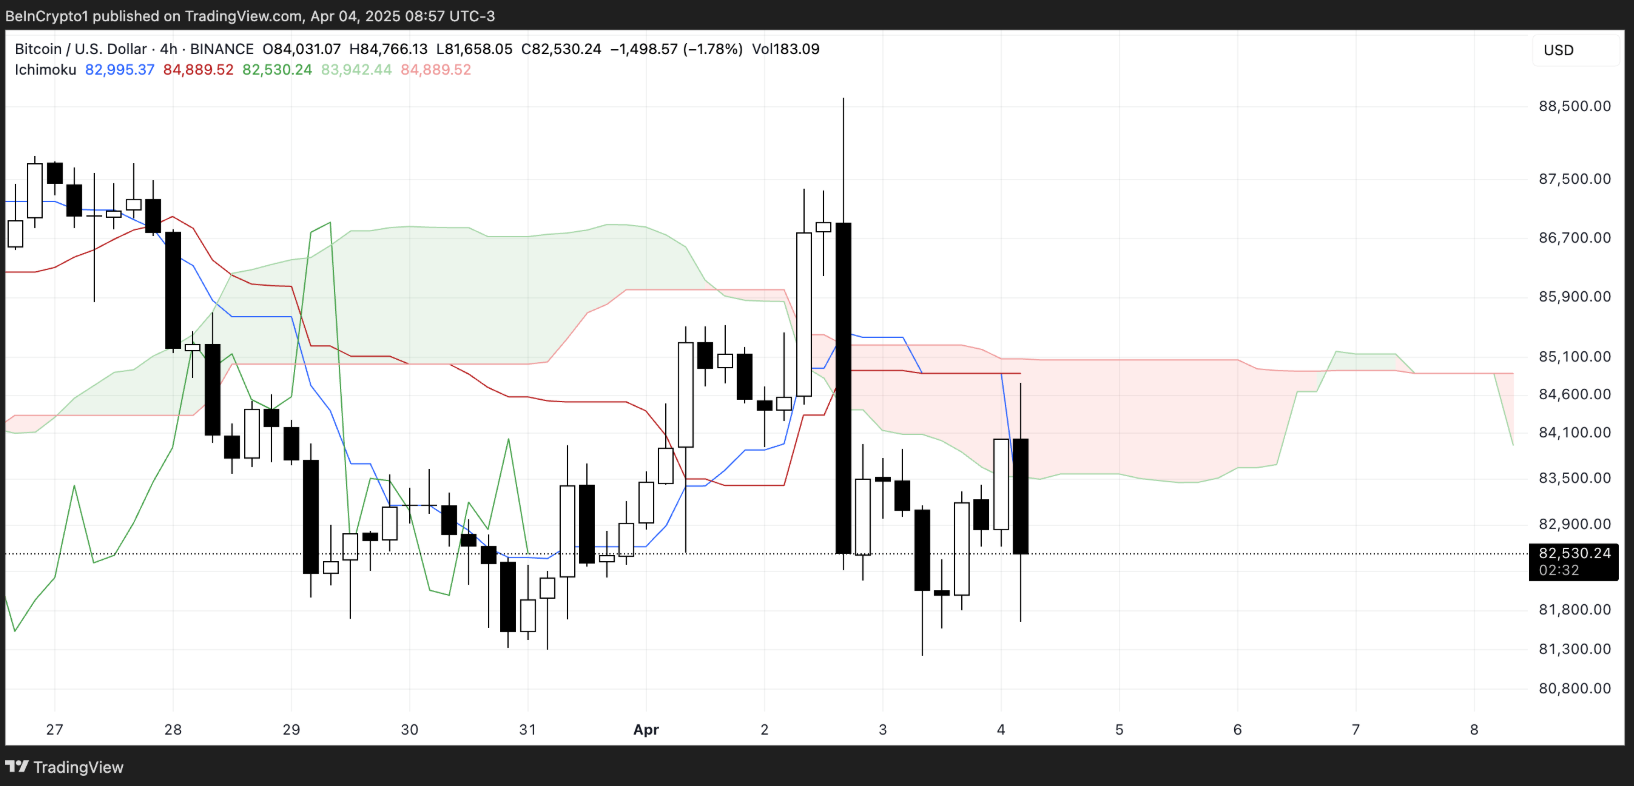 The Ichimoku Cloud indicator on the BTC/USDT 4-hour chart | Source: TradingViewThe conversion line in green (Tenkan-sen) is currently sloping down and has just crossed below the Kijun-sen — a technical signal often warning of short-term bearish pressure. At the same time, Span A (the lower boundary of the cloud – green) is starting to go sideways, while Span B (the upper boundary of the cloud – red) is maintaining a flat state, forming a thin and neutral cloud ahead of the chart.
Thin and flat clouds like this often reflect market hesitation, indicating that both buyers and sellers lack the confidence to lead the trend. The fact that BTC prices are currently fluctuating just below the cloud region further reinforces the possibility that the market is entering an accumulation phase, rather than pursuing a clear upward or downward trend.
In that context, if BTC can break above the cloud and maintain stability, this will be an important signal indicating that demand is returning and an upward trend may be triggered. Conversely, if it continues to be rejected at the cloud level and faces pressure from the weakening Tenkan-sen, it is highly likely that BTC will continue to move sideways or enter a short-term correction.
Currently, the Ichimoku Cloud structure is sending a clear message of uncertainty — no trend is strong enough to take control of the market.
Can Bitcoin return to the $88,000 mark in April?
The exponential moving average structure (EMA) of Bitcoin is still leaning towards a downtrend, with long-term EMAs positioned above short-term EMAs. However, recovery signals are gradually appearing, with short-term EMAs starting to rebound – a sign that a recovery may be forming.
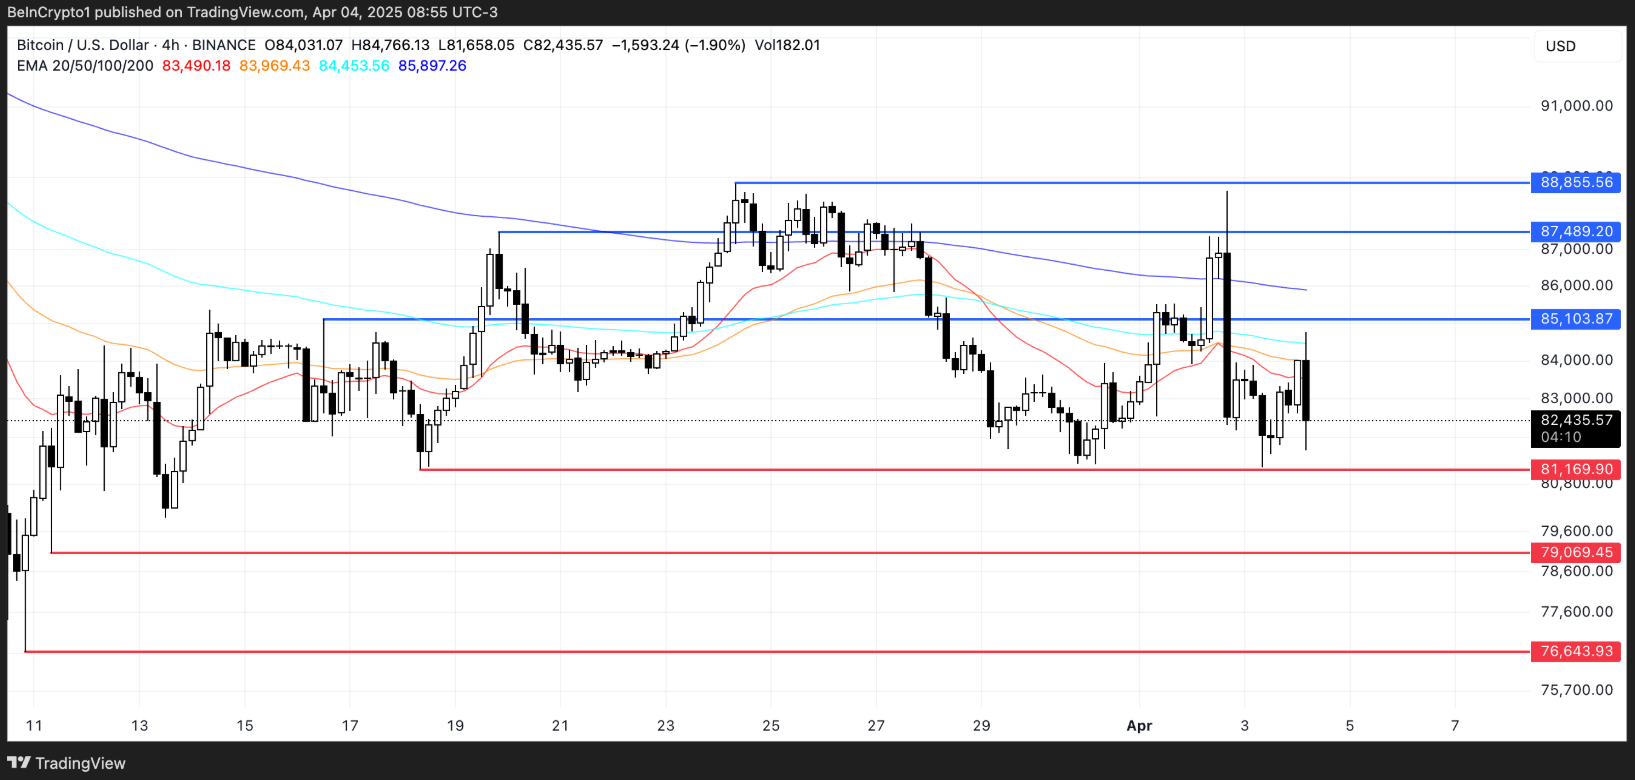 BTC/USDT 4-hour chart | Source: TradingViewIf this trend continues, Bitcoin is likely to test the important resistance level at $85,103. A breakout above this level could trigger a shift in market momentum, setting the stage for a stronger rally, with subsequent target levels such as $87,489. Notably, Standard Chartered bank recently also forecasted that BTC could surpass $88,500 as early as this weekend.
In a positive scenario, if demand continues to be sustained, Bitcoin could extend its rally to $88,855 — a milestone indicating that the market is recovering strongly after the recent correction.
“After the drop on Wednesday, BTC has surged over 4% and is currently stabilizing above the $79,000 mark. A strong support zone is forming around the $80,000 level, accompanied by a slight increase in daily trading volume – this is a positive sign. At the same time, the inflow of money into Bitcoin ETF funds also reflects market sentiment remains optimistic, with an impressive figure of $220 million recorded on April 2nd – known as ‘Tax Day’,” according to cryptocurrency analyst Nic Puckrin.
However, if Bitcoin cannot maintain this upward momentum, the risk of a correction still exists. The nearest support level to watch is $81,169. In the context of escalating US-China trade tensions, if this support level is breached, Bitcoin could fall below the psychological threshold of $80,000, with the next target at $79,069. If this area also cannot hold, selling pressure may significantly increase, dragging the price down further to $76,643.
Disclaimer: This article is for informational purposes only and is not investment advice. Investors should conduct thorough research before making decisions. We are not responsible for your investment decisions.
- Bitcoin remains strong despite the US stock market losing $3.5 trillion due to Trump and warnings from the Fed
- Bitcoin sentiment has dropped to its lowest level since 2023, but a “risk-on” environment may emerge to drive a rally.
SN_Nour
@media only screen and (min-width: 0px) and (min-height: 0px) {
div[id^=“wrapper-sevio-d89f58f5-7b63-40be-98c0-6b1fd62584fb”] {
width:320px;
height: 100px;
}
}
@media only screen and (min-width: 728px) and (min-height: 0px) {
div[id^=“wrapper-sevio-d89f58f5-7b63-40be-98c0-6b1fd62584fb”] {
width: 728px;
height: 90px;
}
}
