 The native token of Ethereum, Ether (ETH), has experienced four consecutive months of decline, with a drop of 18.47% just in March. The current market structure of ETH reflects a prolonged bearish trend, which is rare since the bear market period of 2022.
With each monthly candle closing lower than the previous month’s low, analysts are starting to question whether ETH is gradually hitting a bottom or if there is still room for further decline.
ETH/BTC ratio hits a 5-year low
On March 30th, the Ethereum/Bitcoin ratio (ETH/BTC) dropped to its lowest level in 5 years, at 0.021. This index measures the value of ETH compared to Bitcoin, and the current decline highlights the poor performance of ETH relative to Bitcoin over the past 5 years.
Notably, the last time the ETH/BTC ratio fell to 0.021 was in May 2020, when the price of ETH only fluctuated between $150 and $300.
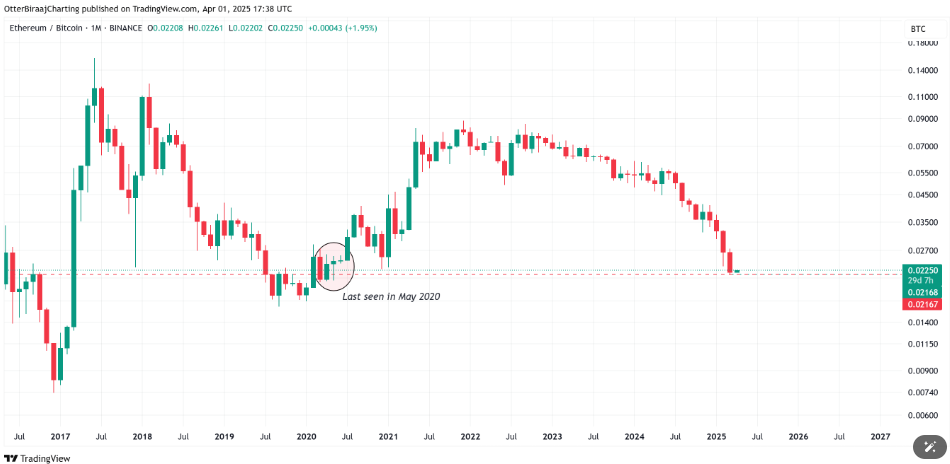 Ethereum/Bitcoin chart for 1 month. Source: TradingViewAccording to data from Token Terminal, Ethereum’s monthly transaction fees have fallen to just $22 million in March 2023, the lowest level since June 2020. This indicates a significant decrease in network activity and market interest.
Transaction fees on Ethereum reflect the costs that users must pay to execute transactions, which depend on the demand for network usage. When transaction fees decrease, it indicates a weakening in the utilization of the Ethereum network.
Prediction about ETH/BTC bottom
Despite the downward price trend and the decline in revenue from transaction fees, the renowned Ethereum analyst VentureFounder predicts that the ETH/BTC ratio could hit a bottom in the coming weeks.
 Ethereum fees and prices | Source: token terminalHe suggests that the potential bottom could range from 0.017 to 0.022, while also indicating that this rate may decline further before recovering.
VentureFounder noted: “There may be a lower RSI and another price drop. The current situation has many similarities to the Fed’s tightening cycle during 2018-2019. I expect the first higher increase to occur after the FOMC meeting in May, when the Fed ends QT and shifts to QE.”
 Analysis of Ethereum/Bitcoin by the founder of Venture | Source: X.com## Historical probability supports a short-term bottom
Since its establishment, ETH has experienced at least three consecutive months of decline in 5 instances, each time leading to a short-term bottom. The longest recorded decline occurred in 2018 with seven consecutive months of red, but right after that, the price of ETH surged by 83% after the correction.
In 2022, after three consecutive months of decline, the price of ETH entered a sideways state lasting nearly a year. However, the bottom was confirmed in June 2022, which was the third red candle. According to historical data, Ethereum has a 75% probability of recording a price increase in April.
Based on the average quarterly profits of Ethereum, the second quarter is usually the least bearish period compared to other quarters. With an average profit of 60.59% in the second quarter, the likelihood of ETH achieving positive growth in April is very high.
 Ethereum’s quarterly profit | Source: CoinGlass## Conclusion
Although ETH is facing prolonged downward pressure, historical data and technical analysis suggest that a short-term bottom may soon appear. However, investors need to be cautious and closely monitor macroeconomic factors, especially monetary policies from the Fed, in order to make appropriate decisions.
Disclaimer: This article is for informational purposes only and is not investment advice. Investors should do thorough research before making decisions. We are not responsible for your investment decisions.
- The price of Ethereum has dropped nearly 50% since Eric Trump confirmed ‘buying ETH’.
- ETH recorded the largest decline in history in Q1, will April be different?
Mr. Teacher
@media only screen and (min-width: 0px) and (min-height: 0px) {
div[id^=“wrapper-sevio-d89f58f5-7b63-40be-98c0-6b1fd62584fb”] {
width:320px;
height: 100px;
}
}
@media only screen and (min-width: 728px) and (min-height: 0px) {
div[id^=“wrapper-sevio-d89f58f5-7b63-40be-98c0-6b1fd62584fb”] {
width: 728px;
height: 90px;
}
}
Disclaimer: The information on this page may come from third parties and does not represent the views or opinions of Gate. The content displayed on this page is for reference only and does not constitute any financial, investment, or legal advice. Gate does not guarantee the accuracy or completeness of the information and shall not be liable for any losses arising from the use of this information. Virtual asset investments carry high risks and are subject to significant price volatility. You may lose all of your invested principal. Please fully understand the relevant risks and make prudent decisions based on your own financial situation and risk tolerance. For details, please refer to
Disclaimer.
