 Supporters of Bitcoin (BTC) are working to drive a recovery, but strong selling pressure at higher levels continues to hinder any efforts to break through the resistance zone. Veteran trader Peter Brandt stated on X that Bitcoin has broken the descending wedge pattern, increasing the risk of a correction down to $65,635.
According to Nic Puckrin, the founder of Coin Bureau, the current macroeconomic context along with concerns about a prolonged trade war has increased the likelihood of an economic recession occurring in 2025 to 40%. He stated that economic recession and macroeconomic instability could put significant pressure on risky assets such as cryptocurrencies.
However, not all analysts have a pessimistic view on Bitcoin in the short term. Stockmoney Lizards noted on X that Bitcoin may have formed a local bottom in the $82,000–$80,000 range and predicts it will soon reverse next week.
If Bitcoin starts to recover, some altcoins may also benefit and rise in price accordingly. Let’s analyze the charts of the top cryptocurrencies that are signaling a bullish trend.
BTC Technical Analysis
The inability of Bitcoin to break through the resistance level may have triggered selling activity from traders. The bears will attempt to pull the price back to the important support zone at $80,000.
 BTC/USDT daily chart | Source: TradingViewThe 20-day exponential moving average (EMA) at $85,253 is moving sideways, and the relative strength index (RSI) is just below the average, giving a slight advantage to the bears. If the support level at $80,000 is broken, the BTC/USDT pair could drop to $76,606.
Conversely, if the price recovers from the current level or $80,000, this will increase the likelihood of breaking through the resistance line. If this scenario occurs, it could signal the end of the correction phase. The BTC/USDT pair could rise to $95,000 and even reach $100,000.
 BTC/USDT 4-hour Chart | Source: TradingViewOn the 4-hour chart, the 20-period EMA has started to decline, and the RSI is in the negative zone, indicating that the bears are in control. If the price continues to drop, this pair could slide down to $80,000, even $78,000.
The bulls will have to push the price above the 20-period EMA to show strength. At that point, the price could rise to the resistance level, which will be an important level to watch. Bullish momentum may begin when Bitcoin breaks the $89,000 level.
Technical Analysis of TON
Toncoin (TON) bounced from the moving averages on March 30, indicating positive sentiment in the market.
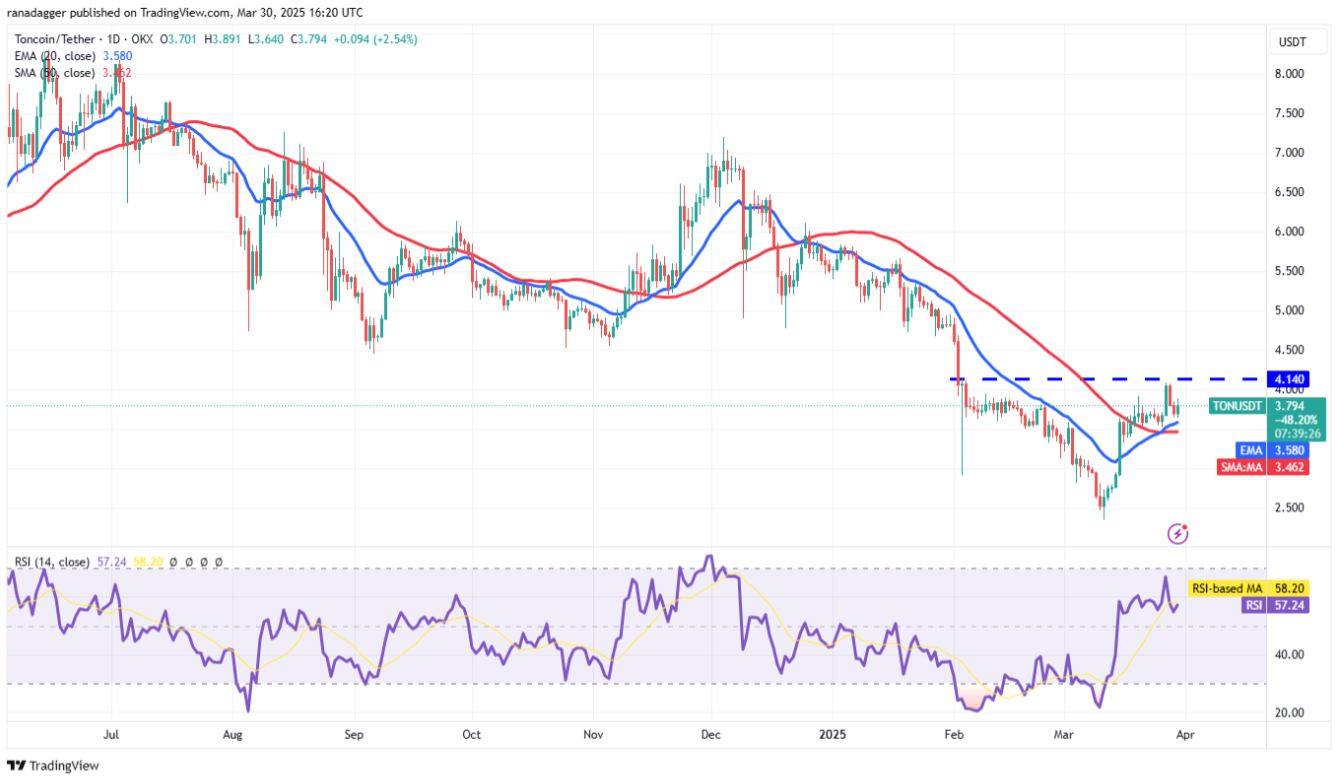 TON/USDT Daily Chart | Source: TradingViewThe 20-day EMA is sloping upwards ($3.58 and the RSI being in the positive zone is giving an advantage to the bulls. The buyers will attempt to solidify their position by pushing the price above the $4.14 resistance. If successful, the TON/USDT pair could start a new rally up to $5 and even $5.65.
Conversely, the bears will have to pull the price down below the support level of $3.3 to gain control. If this happens, it will confirm that the bears continue to sell off as the price rises. At that point, this currency pair could drop to $2.81 and then to $2.64.
![])https://img.gateio.im/social/moments-1f10092c5788c765fafcf3378d04ded5(TON/USDT 4-hour chart | Source: TradingViewThe TON/USDT pair has reversed from the uptrend line, indicating that the bulls are taking advantage of the dips as a buying opportunity. The price may target the resistance level of $4.14, where the bears are expected to intervene. However, if the bulls surpass this resistance level, the pair may enter the next bullish phase towards $5.
If the bears regain control by pulling the price below the uptrend line and maintaining it there, the TON/USDT pair could drop to $3.28.
Technical Analysis of CRO
Cronos )CRO( broke above the moving averages on March 24, signaling that the downtrend may have ended.
![])https://img.gateio.im/social/moments-1fca2b1768a48d587613965191525bdf(Daily CRO/USDT chart | Source: TradingViewThe CRO/USDT pair is facing selling pressure near the $0.12 level, but a positive sign for the bulls is that they are not allowing the price to stay below the $0.10 support level. This indicates that buyers are trying to form a higher low. If the bulls push the price above $0.12, this pair could rise to $0.14.
However, the bears may have a different strategy. They will try to pull the price below the moving averages to trap optimistic investors.
![])https://img.gateio.im/social/moments-1bc534159822541c31292f11b974d7c6(CRO/USDT 4-hour chart | Source: TradingViewThis currency pair has been stuck in the price range of $0.10 to $0.12, indicating hesitation between the bulls and bears. The 20-period EMA is gradually sloping upwards, and the RSI is just above the average, giving a slight advantage to the bulls. If the price breaks out and closes above $0.11, there is a high likelihood of a price increase exceeding $0.12.
The bears will regain control if they pull the price below the )SMA( 50-period simple moving average. If this happens, the CRO/USDT pair could drop to $0.08.
Technical Analysis of MNT
The price of Mantle )MNT( has been unable to surpass the 50-day moving average )SMA( at $0.84 in recent days. However, a positive signal is that the bulls are trying to keep the price above the 20-day exponential moving average )EMA( at $0.80.
![])https://img.gateio.im/social/moments-d3b3bee712351112ed393214e36ee60b(Daily MNT/USDT chart | Source: TradingViewIf the price strongly rebounds from the 20-day EMA, it indicates that market sentiment has shifted from selling on price increases to buying on price decreases. This increases the likelihood that the price could break through the 50-day SMA resistance level. If this scenario occurs, the MNT/USDT pair could rise to $0.94 and then to $1.06.
Conversely, if the price continues to decrease and breaks the support level of $0.77, the short-term advantage will lean towards the bears. At that point, this currency pair could drop to $0.72, delaying the bullish trend.
![])https://img.gateio.im/social/moments-c9ad77c9d9220bf7c92204649df1d3b8(MNT/USDT 4-hour Chart | Source: TradingViewOn the 4-hour chart, the MNT/USDT pair is facing strong resistance at $0.85. If the price drops to $0.77, this will be an important support level to watch. If the price bounces back from $0.77, it will indicate that the bulls are still actively buying on the dips. This scenario could keep the price oscillating within the range of $0.77 – $0.85 for a while. A breakout and close above $0.85 could push the price up to $0.95.
On the contrary, the bears need to pull the price down below $0.77 to gain control. If this happens, the pair could continue to drop to $0.69.
Technical Analysis of RNDR
The price of Render )RNDR( has been on a strong downward trend for the past few weeks, but the bulls pushed the price above the 50-day SMA )$3.77( on March 25, indicating buying demand at lower price levels.
! [])https://img.gateio.im/social/moments-b622fc6fc92e79b4532663846e180321(Daily RNDR/USDT Chart | Source: TradingView However, the bears dragged the price down to the 20-day EMA )$3.57(, an important level to watch. If the price bounces sharply from the 20-day EMA, the bulls may try to take the RNDR/USDT pair to $5 and then to $6.20.
This positive outlook will be invalidated in the short term if the price continues to drop and closes below $3.05. This would signal that the bears are acting strongly at higher price levels. At that point, the pair could drop to $2.83 and even $2.52.
![])https://img.gateio.im/social/moments-d9b19159ca398330a9dee638f4e0c540(RNDR/USDT 4-hour chart | Source: TradingViewOn the 4-hour chart, the 20-period EMA has turned down and the RSI is in the negative zone, indicating that the bears are in control. If the price breaks and closes below the upward trend line, it will further strengthen the bears, pulling the price down to $3.
The first sign of recovery will be a breakout and a close above the moving averages. If this happens, the RNDR/USDT pair could bounce up to $4. The bullish momentum may strengthen further after the price surpasses $4.20, completing the inverted head and shoulders pattern – a significant bullish signal.
You can view the coin price here.
Disclaimer: This article is for informational purposes only and is not investment advice. Investors should do their own research before making any decisions. We are not responsible for your investment decisions.
- 5 signs that Bitcoin will rise again this year
- Bitcoin could account for 25% of the S&P 500 by 2030: Architect Partners
SN_Nour
@media only screen and )min-width: 0px( and )min-height: 0px( {
div[id^=“wrapper-sevio-d89f58f5-7b63-40be-98c0-6b1fd62584fb”] {
width:320px;
height: 100px;
}
}
@media only screen and )min-width: 728px( and )min-height: 0px( {
div[id^=“wrapper-sevio-d89f58f5-7b63-40be-98c0-6b1fd62584fb”] {
width: 728px;
height: 90px;
}
}
