What is a long-moving average array?
A long moving average array includes the Candlestick charts, as well as the short-term, medium-term, and long-term moving averages, that are ordered from top to bottom and all point upward. For example, if you find the Candlestick charts, the MA5, the MA30, the MA60, and the MA120 are aligned from top to bottom and heading upward in the daily Candlestick charts, you can determine those lines are arranged in a long pattern form.
When a long moving average array appears, it means all positions are profiting in every period of the moving average, and the market is in a bullish trend.
Identity long moving average array
- It appears in an up-trending market.
- Candlestick charts and moving averages of short-term, medium-term, and long-term are arranged from top to bottom and point upward. In most cases, all the moving averages, irrespective of the period, are moving in the path of an upward arc.
- The indications of long moving average array Implications of the long moving average array: When this pattern appears, it indicates that the market is experiencing a powerful upward wave, which presents significant trading opportunities. Traders who have not yet opened positions can benefit from the trend if they do so at the right time when the market is moving to the point where the best price emerges. Those who already have positions should maintain them with more confidence, and any decisions to give up position holding are viewed as unwise in such circumstances.
Usage
Long-moving average array
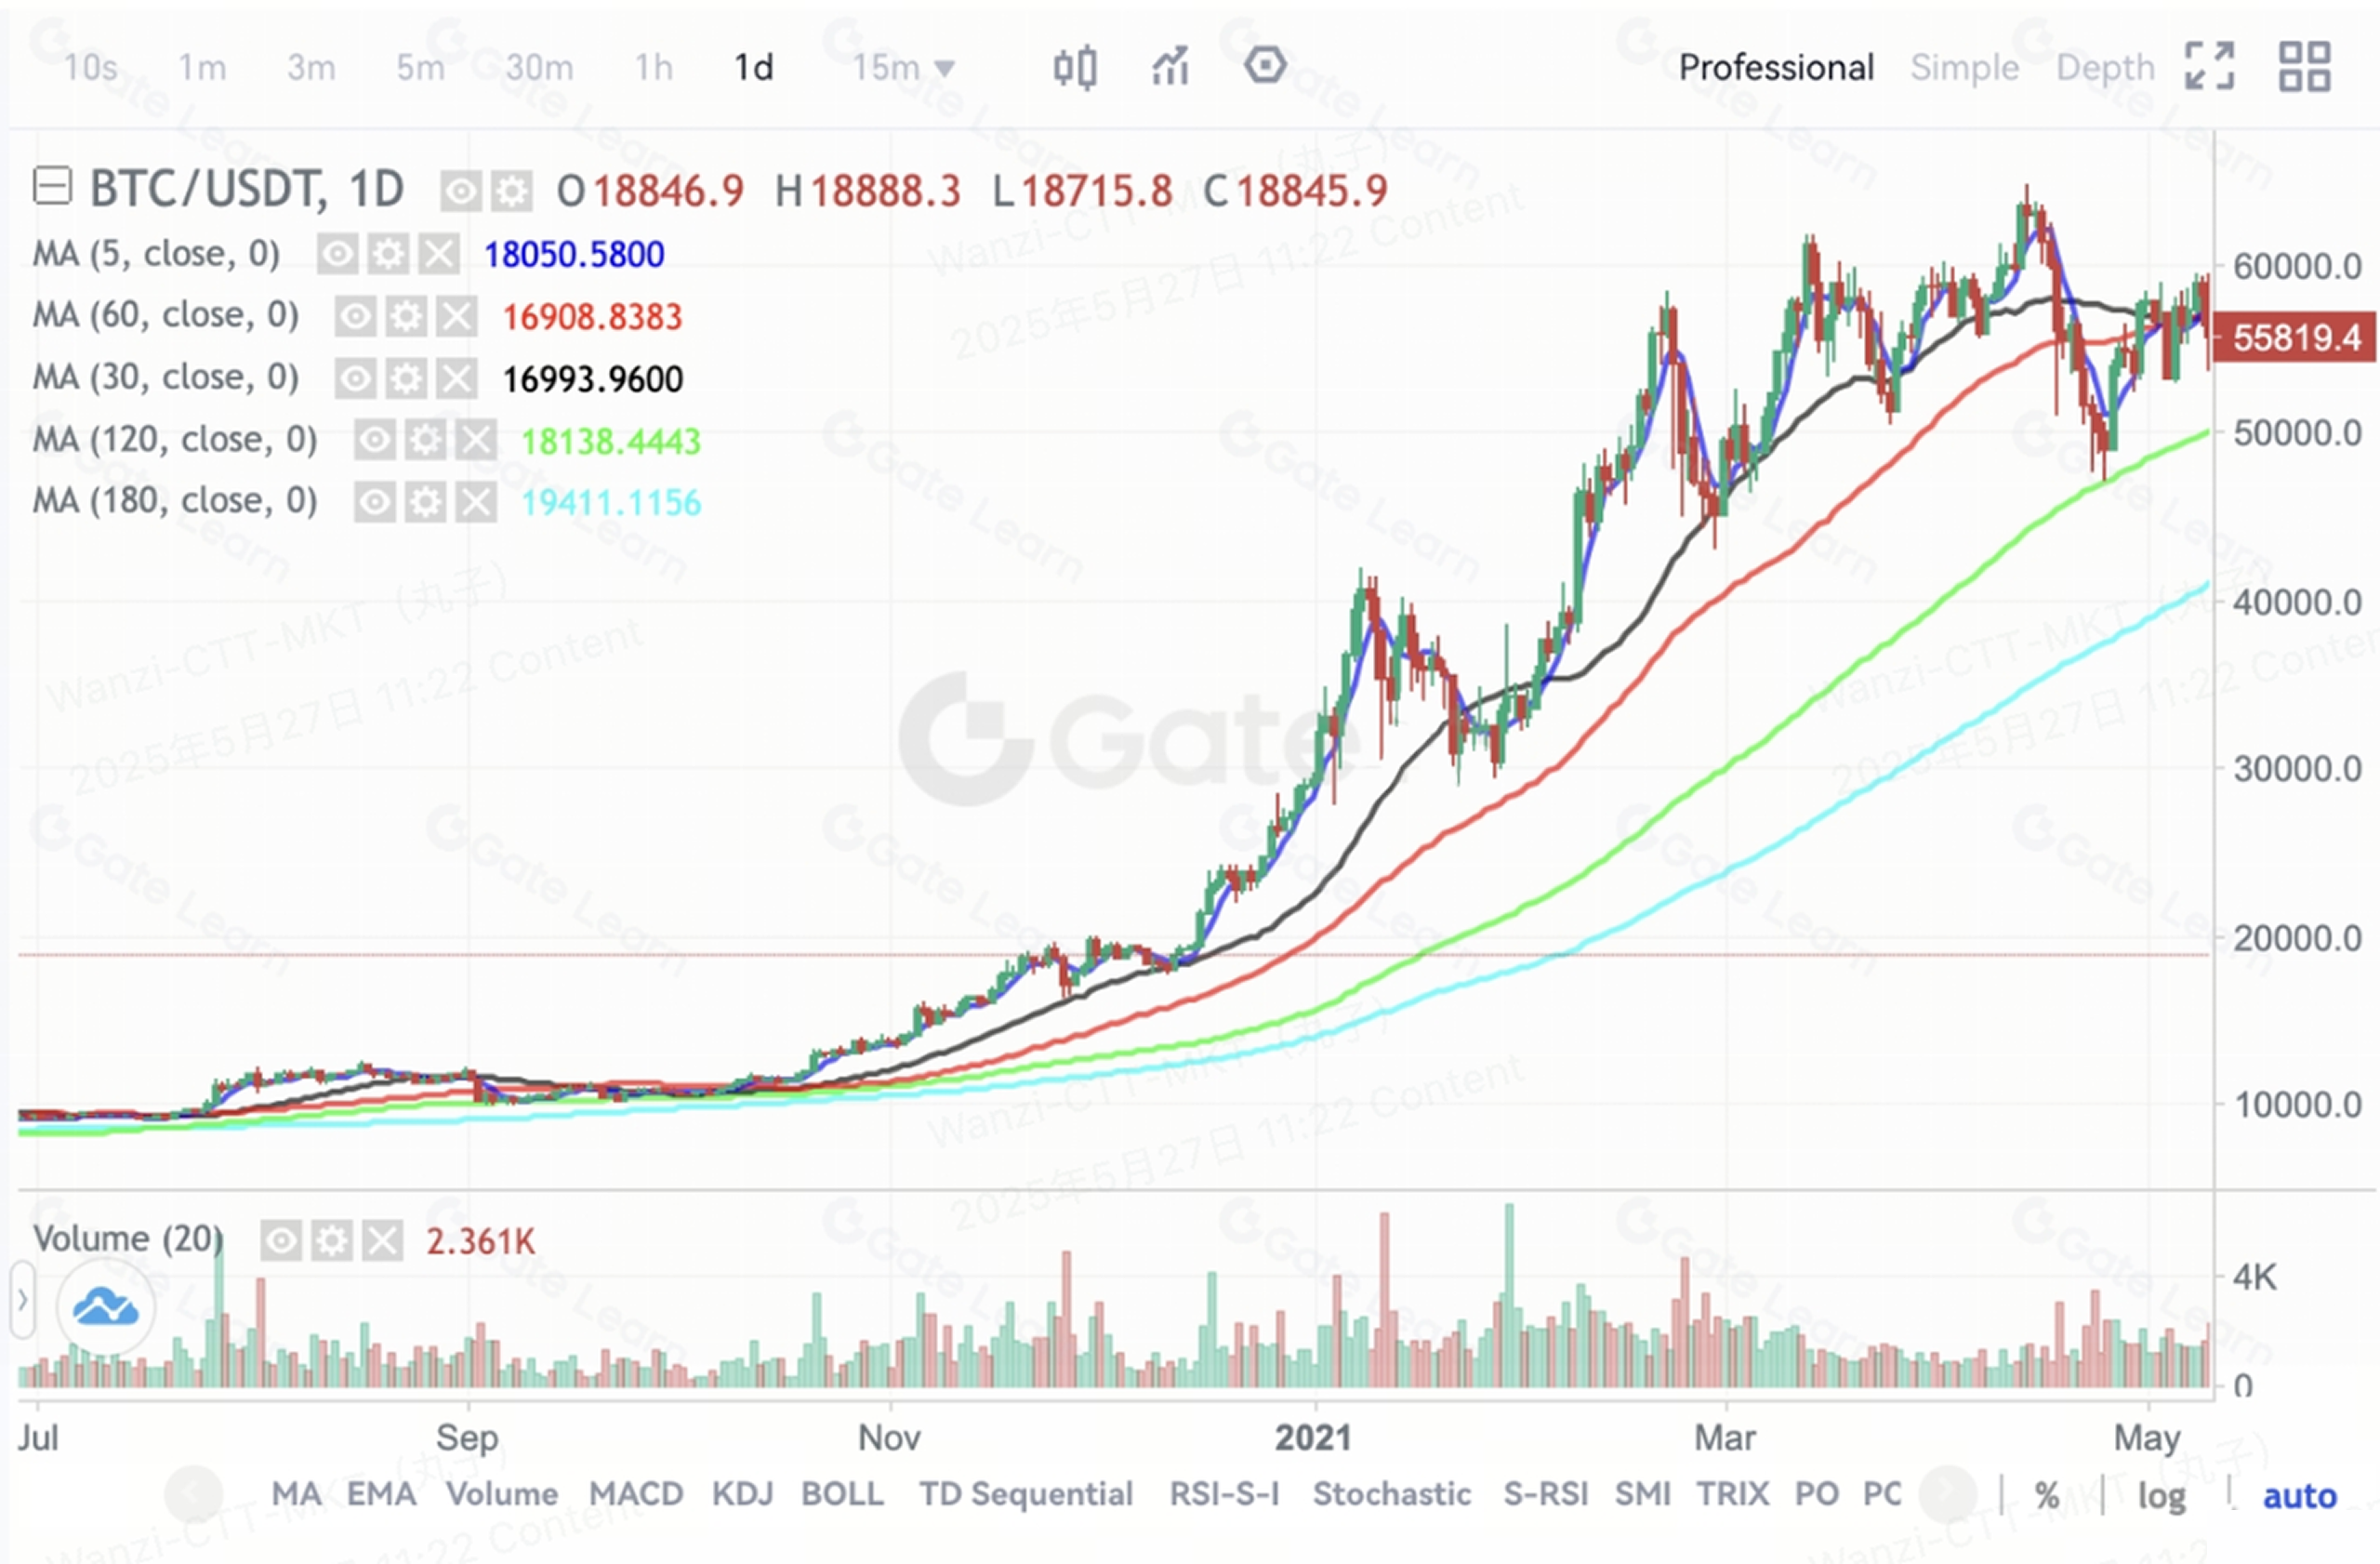
The above is the daily Candlestick charts of the Gate Futures BTC, in which the MA5, MA30, MA60, MA120, and MA180 are arranged in order from top to bottom, and are moving in an upward trend. This is a typical example of a long-moving average array, indicating the market is experiencing a powerful BTC bullish wave.
Issues of attention
- Although more reliable, the moving average for a long period often performs with a lag in reflecting the market trend.
- The two natures of a moving average, i.e., stability and lagged reaction always come hand in hand. It is also the case with the long moving average array. That means if you favor the long moving average array for its stable performance in market prediction, you must endure its disadvantage of being unresponsive. In practice, the price might have been on the rise for a long time before the long-term moving average is formed.
Summary
The moving average performs best when combined with other technical tools because it has the drawback of a delayed reaction to market movement. Users can choose when to open positions in trading by studying the K-line, trend line, or technical indicators, and they can then closely monitor the movement of the moving average to choose the optimal trading time.
Please click to register on the Gate Futures platform to start trading!
Disclaimer
This article is for informational purposes only and does not constitute any investment advice, nor is Gate responsible for any of your investments. Content related to technical analysis, market judgment, trading skills, and traders’ sharing cannot be used on an investment basis. Investment may involve potential risks and face uncertainties. This article does not contain or imply any guarantee for returns on any type of investment.