How to use the bearish reversal pattern - head and shoulders top
Gate Learn futures intermediate topic helps users to build a framework system of technical analysis, including candlestick fundamentals, technical patterns, averages and trendlines, and the application of technical indicators. This issue will explain the application of the technical analysis pattern - Head and Shoulders Top, from the concept, characteristics, BTC application and precautions for you.
What is a Head and Shoulders Top
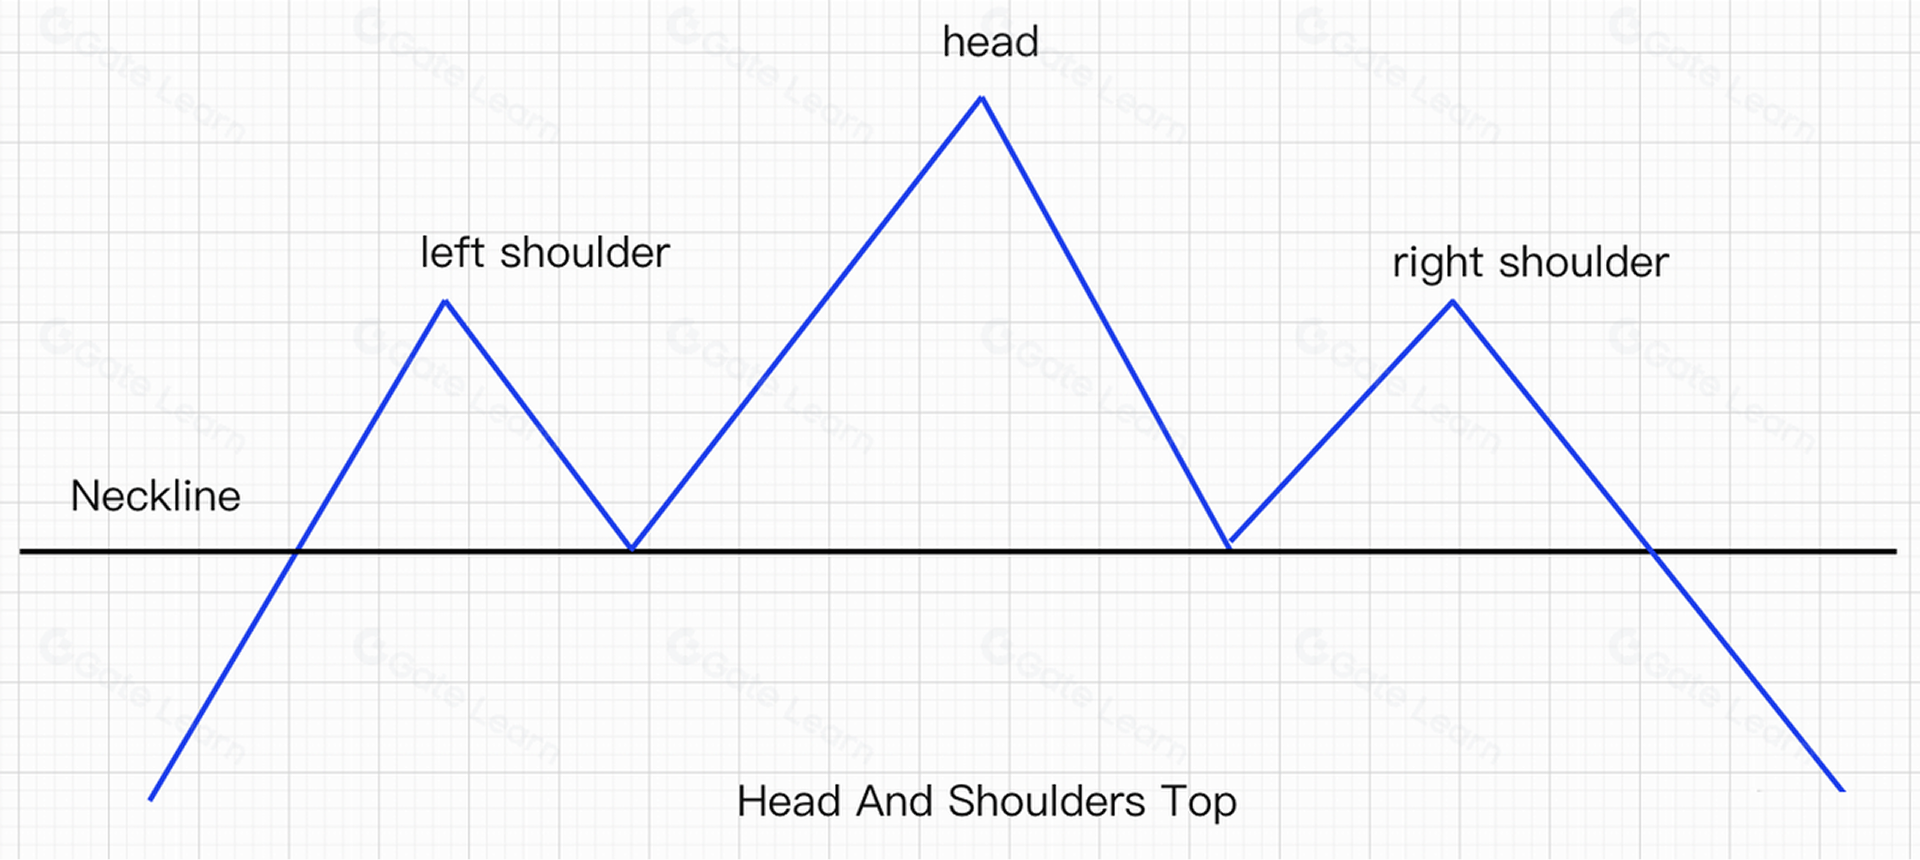
A Head and Shoulders Top forms when the price significantly increase and the trend forms three peaks, where the outside two are slightly higher than the middle peak. The three peaks are called the left shoulder, head and right shoulder respectively from left to right. The volume of a Head and Shoulders Top often shows a gradual decline as shown in the figure below:
How to identify the Head and Shoulders Top
- It occurs in a strong upward trend with a strong rally and large volume.
- In the Head and Shoulders Top pattern, the price will rise and fall three times at the end of the upward trend, forming three obvious peaks. Of these, the middle peak (head) is the highest and the two outside peaks (left head and right head) are low and roughly equal.
- The lows for retracement of the left shoulder and the head are basically the same. Connecting the two lows with a straight line is the Neckline of the Head and Shoulders Top pattern. The last fall of the price effectively below the Neckline marks the formation of the Head and Shoulders Top pattern.
- Volume increases on each rise and decreases on each fall. However, the overall volume decreases in a stepwise manner from the left shoulder, the head, and the right shoulder.
The technical meaning of the Head and Shoulders Top
A Head and Shoulders Top is a reversal pattern of the technical analysis, which often means the end of a bullish market. It also appears at the top of a medium-term uptrend.
The effective breakout of the Neckline indicates a possible reversal of the current uptrend to a new downtrend, which is considered a sell signal.
Application of the Head and Shoulders Top
We know that a Head and Shoulders Top is a reversal signal, which means selling short or selling at the top. The following are three common selling positions in real trading.
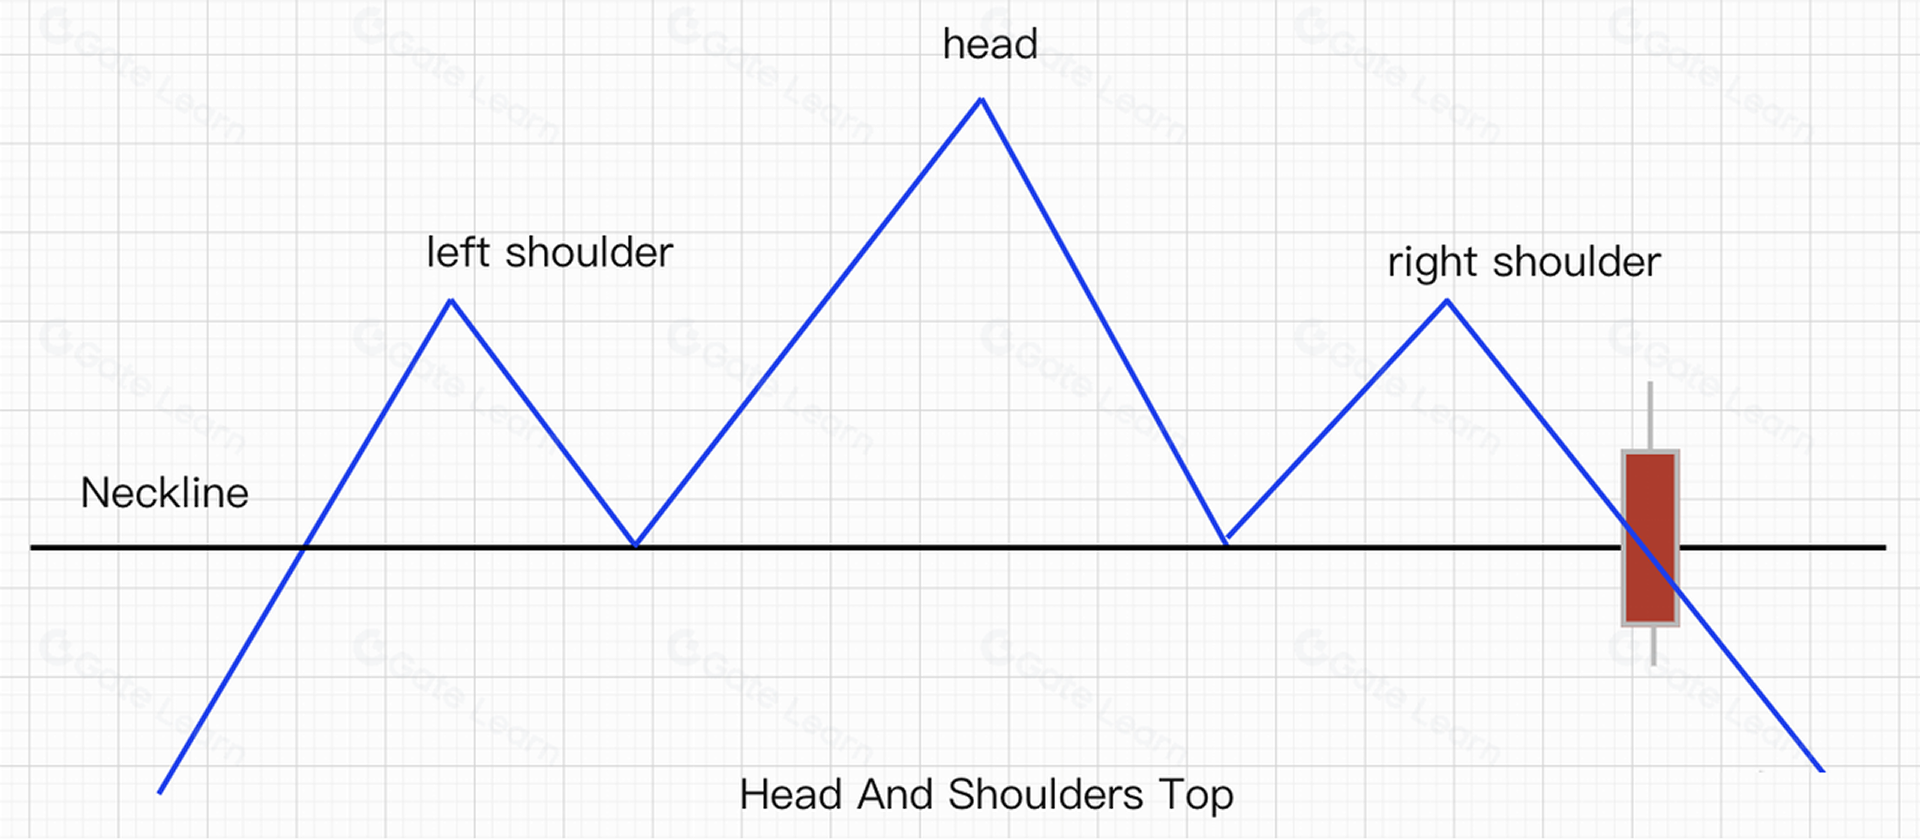
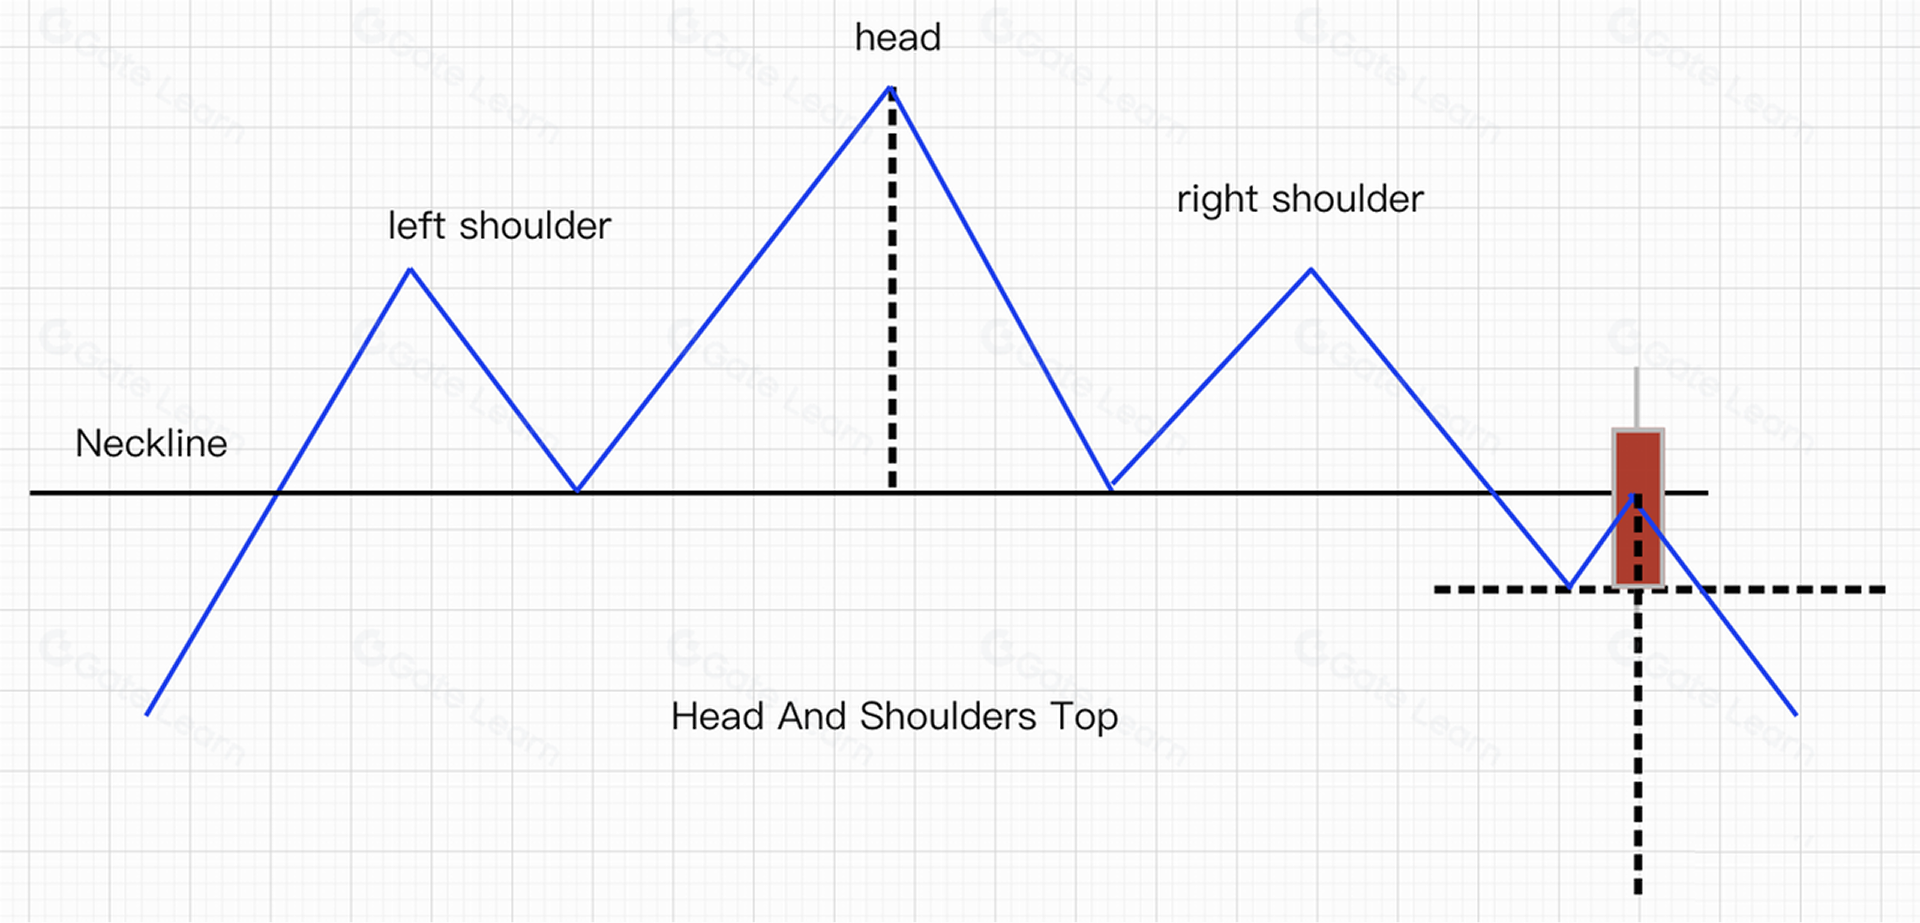
1.When the Head and Shoulders Top pattern is formed, the price falls below the Neckline and closes with a solid negative line, which is the position is a sell position Traders should be alert that there are high probability indicating the market will continue to fall as shown in the following figure:
2.When the Head and Shoulders Top pattern is formed, the price falls below the Neckline, the second rebound does not stabilize the Neckline, and then falls again to close a solid negative line, which is the position is a sell position The accurate signal indicates that the probability of a fall in the market is higher as shown in the figure below:
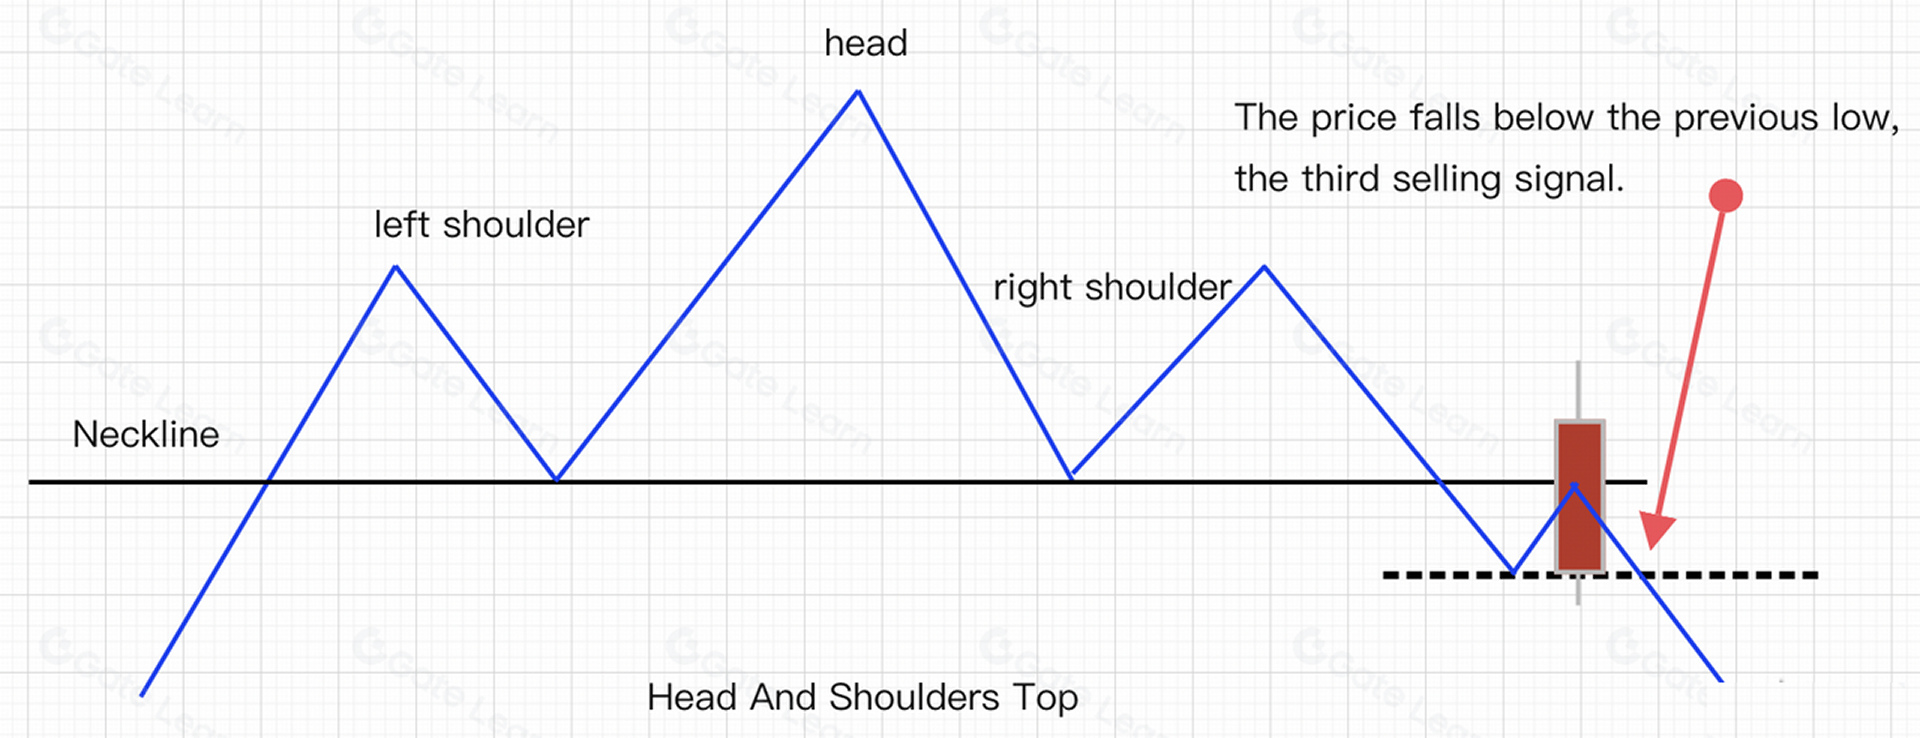
3.When the Head and Shoulders Top pattern is formed, the price touches the Neckline and continues to fall, and falls below the previous low. Then this position is a sell signal 3 as shown in the figure below.
Now, let’s summarize the rules for applying a Head and Shoulders Top pattern.
The first thing to confirm is the three important components of the Head and Shoulders Top pattern, which are the left shoulder, the head, and the right shoulder, and the Neckline serving as an important reference line for selling short or long. As the market continues to change, we find a breakout of the Neckline.
- selling point 1: the price falls below the neckline
- selling point 2: the price falls below the neckline again
- selling point 3: the price breakout near the previous low
- Head and Shoulders Top can also be used to predict future downsides by technical means as follows.
When the Neckline is broken, traders can draw a vertical line from the highest point of the head to the Neckline, and then measure the same length down from the point where the right shoulder completes the breakout of the Neckline, and that price is the minimum extent of the future decline in the price as shown in the figure below:
5 Trading Exemplification
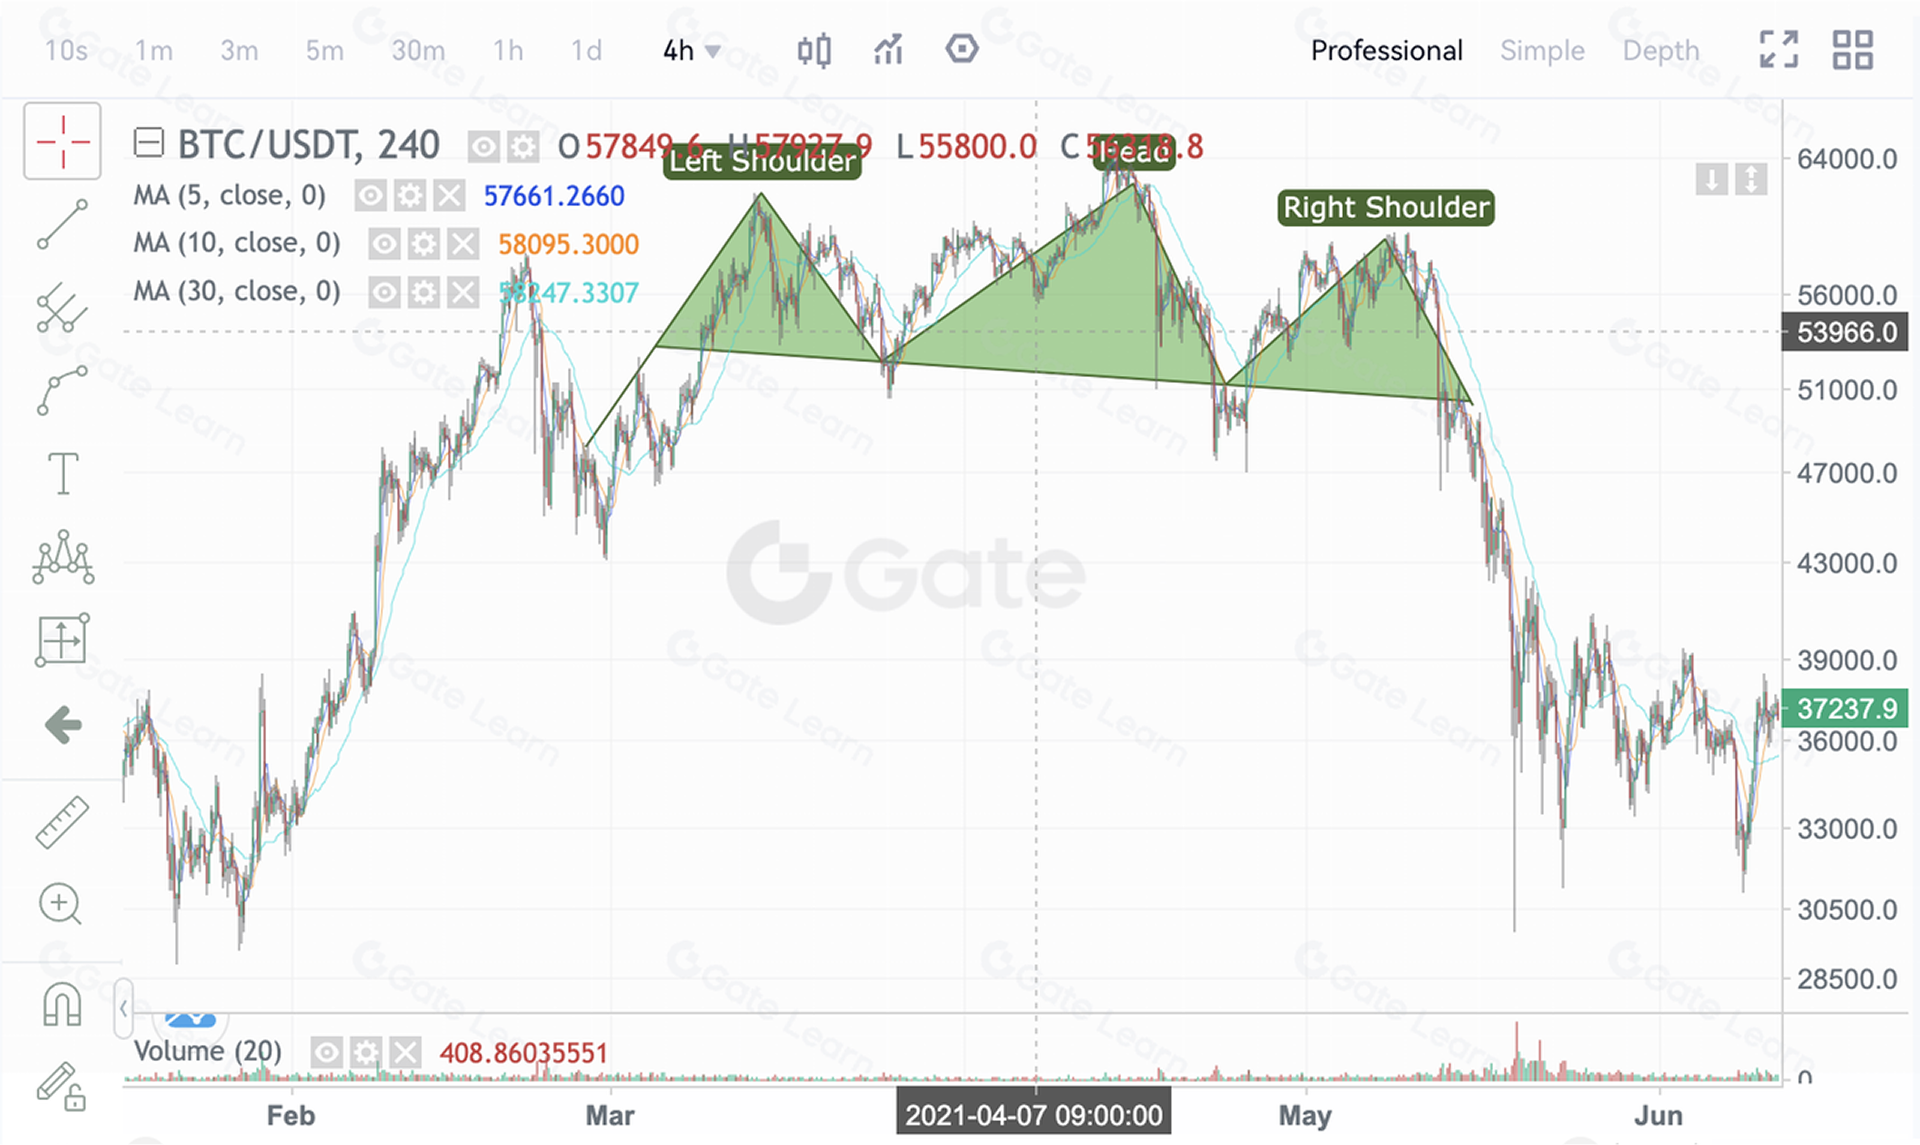
1.BTC Head and Shoulders Top exemplification
The graph shows a 4-hour chart of BTC. From the end of 2020 to May 2021, BTC started a strong bull market, rising from $10,000 to a maximum of $64,000 with an increase of more than 600%. As the bulls gradually weakened, a Head and Shoulders Top pattern was formed at the top of the high fluctuation, and then with a sharp decline, the Neckline at $47,000 was breached, starting a 1-year-long decline.
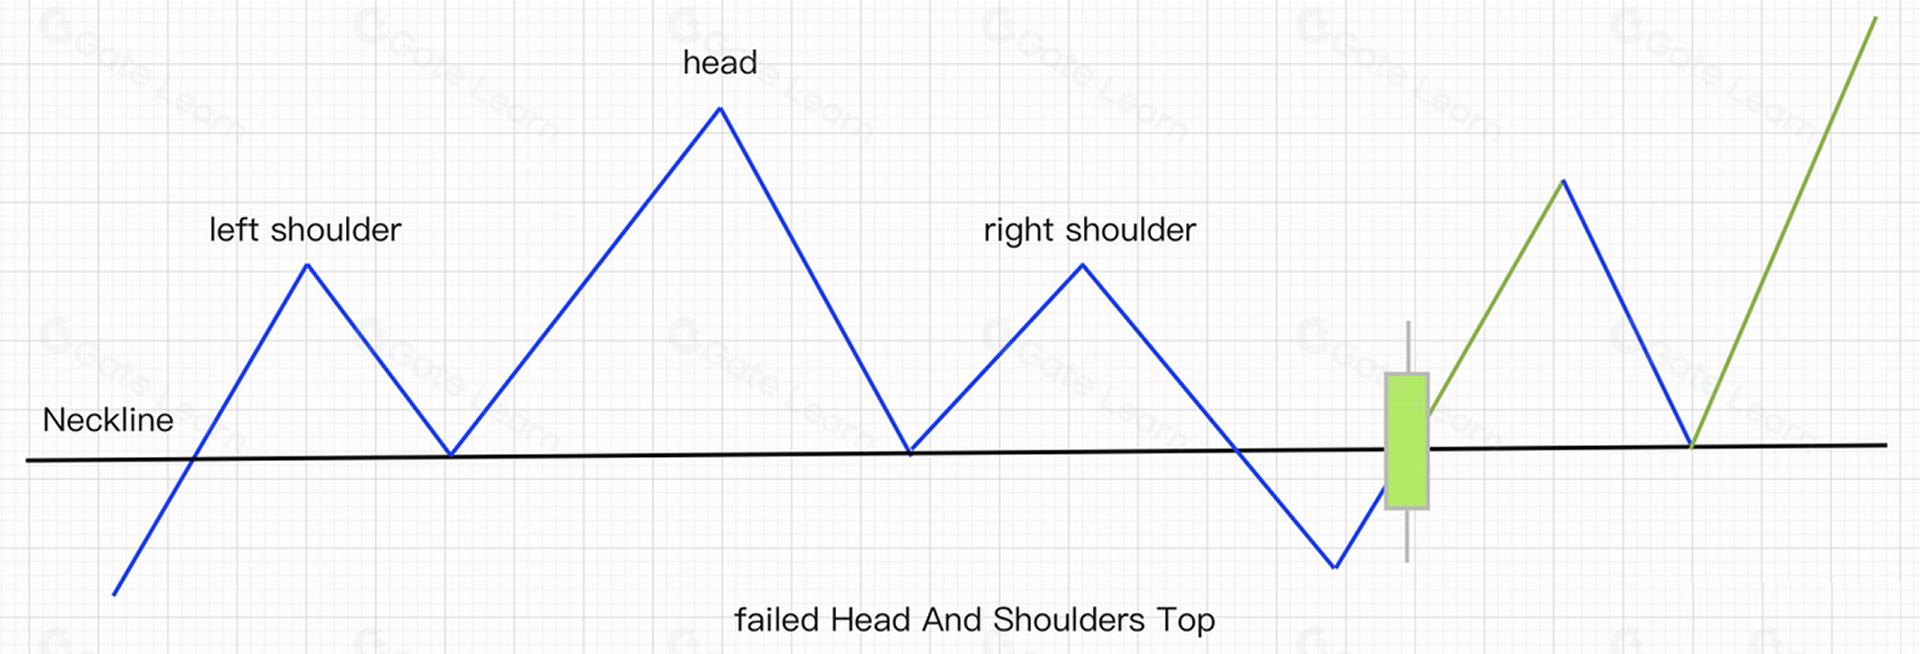
2.A failed Head and Shoulders Top may occur if the price is strongly supported at the Neckline, as shown in the figure below.
A price breakdown through the neckline, followed by strong support and a quick rise to close a solid positive line, could result in a failed Head and Shoulders Top formation. Traders should be cautious of short selling in the future.
6. Summary
Whether the Head and Shoulders Top appears at the top of a long-term trend or the top of a medium-term trend, a breakout of the Neckline is a indication of a trend reversal. The trend has inertia, and a confirmed trend will generally continue to run in the direction of inertia, so a breakout of the Neckline is considered a real sell signal. Although this is a comparison with the peak, the price has fallen by a considerable amount, but the downward trend is just beginning, traders who have not selling short continue to sell.
Note that futures trading can take a while to perfect, while practicing what you learned will make you more proficient in the futures market. Click on the Gate Futures platform and register to start your futures trading journey.
Disclaimer
This is for your reference only. The information provided by Gate above is not investment advice and is not responsible for any investment you may make. The information regarding technical analysis, market judgments, trading tips, and trader sharing may involve potential risks, investment variables, and uncertainties, and this issue does not provide or imply any opportunity for guaranteed returns.
Lesson 1:What is Crypto-Market Technology Analysis
Lesson 2:Several Bullish Candlestick Patterns
Lesson 3:Several Bearish Candlestick Patterns
Lesson 4:How to use the bottom-fishing pattern - head and shoulders bottom
Lesson 5:How to use the bearish reversal pattern - head and shoulders top
Lesson 6:How to use the bottom-fishing pattern - rounding bottom
Lesson 7:How to use the bearish reversal pattern - rounding top
Lesson 8:How to use the bottom-fishing pattern - double bottom (W-shape)
Lesson 9:How to use the bearish reversal pattern - double top (M-shape)
Lesson 10:How to use the bottom-fishing pattern - V-shaped reversal
Lesson 11:How to use the continuation pattern - ascending triangle
Lesson 12:How to use the continuation pattern - descending triangle
Lesson 13:How to use the continuation pattern - other triangle pattern types
Lesson 14:How to use the continuation pattern - flag pattern
Lesson 15:15 How to use the continuation pattern - wedge pattern
Lesson 16:How to use the continuation pattern - rectangle pattern
Lesson 17:Mater technical analysis-Methodology
Related Courses

Tools That Help You Trade Better: Moving Averages, Trend Lines, and Indicators

Gate Futures Trading Guide - A must-read for newbies
ETF Leveraged Tokens — Product Guide

Futures Grid Trading User Guide