


#ETHMarketAnalysis
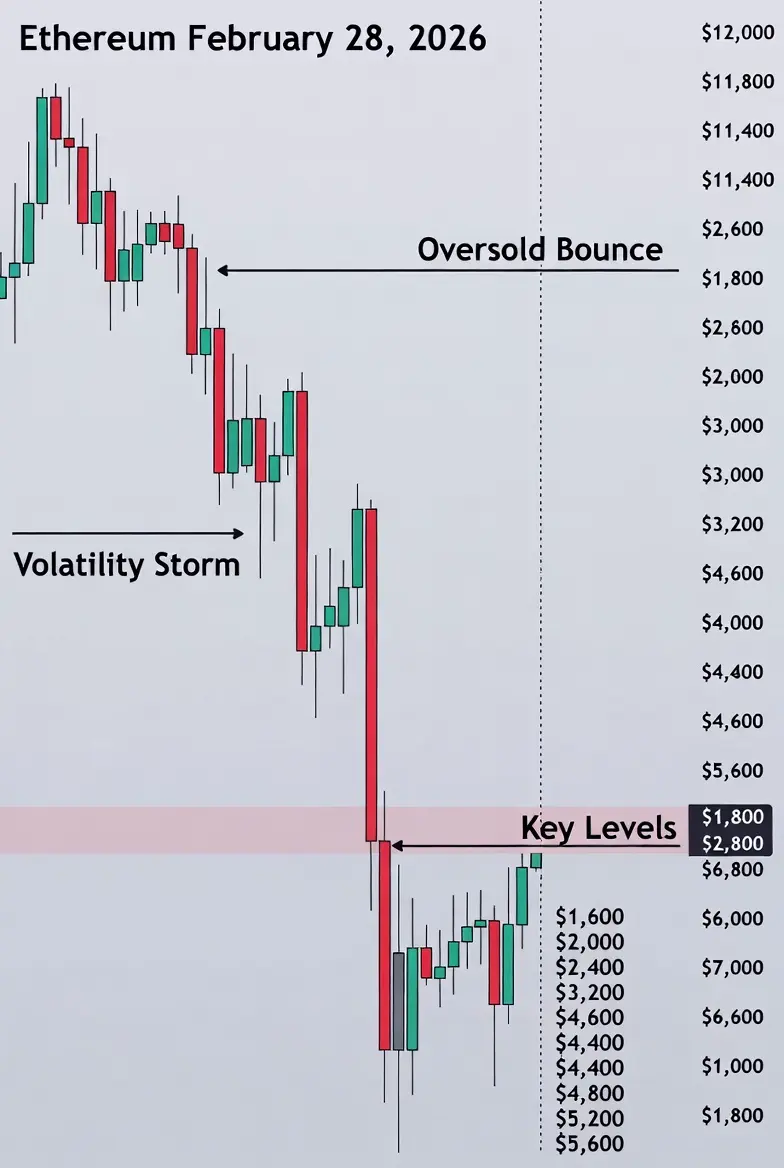
Ethereum has been caught in the same brutal volatility storm as the broader crypto market in early 2026. After riding the 2025 bull wave to fresh all-time highs above $4,800–$5,200 (peaking around September–October 2025 alongside Bitcoin’s surge), ETH crashed hard, dropping over 60% to lows near $1,550–$1,650 in mid-February. The asset is now clawing its way back toward the $1,850 zone, fueled by ETF inflows, oversold technicals, and short covering — but the recovery remains fragile and choppy, with fresh selling pressure today dragging prices lower once again.
Current Ethereum Price (Live as of February 28, 2026)
Current Price: Approximately $1,850 – $1,865 USD (fluctuating; CoinMarketCap showing ~$1,852, CoinDesk ~$1,858 at latest check).
24h Change: Down ~6.2–6.8%, with 24h range of $1,820 low to $1,980 high.
Market Cap: ~$222 billion.
24h Trading Volume: ~$28 billion.
Key Context: ETH is down ~62% from its October 2025 all-time high of $5,198. It bounced sharply from sub-$1,600 levels earlier this month but is struggling at resistance near $2,000–$2,100. The market is stuck in a wide $1,600–$2,200 range, extremely sensitive to macro headlines and Bitcoin’s movement (ETH/BTC pair currently hovering near 0.029).
Why Did the Market Fall So Low? (Reasons for the February 2026 Crash)
Ethereum’s collapse was not driven by any Ethereum-specific failure (Layer-2 scaling, Dencun upgrade effects, and staking yields remain strong). Instead, it was dragged down by the exact same risk-off macro storm that crushed Bitcoin and equities:
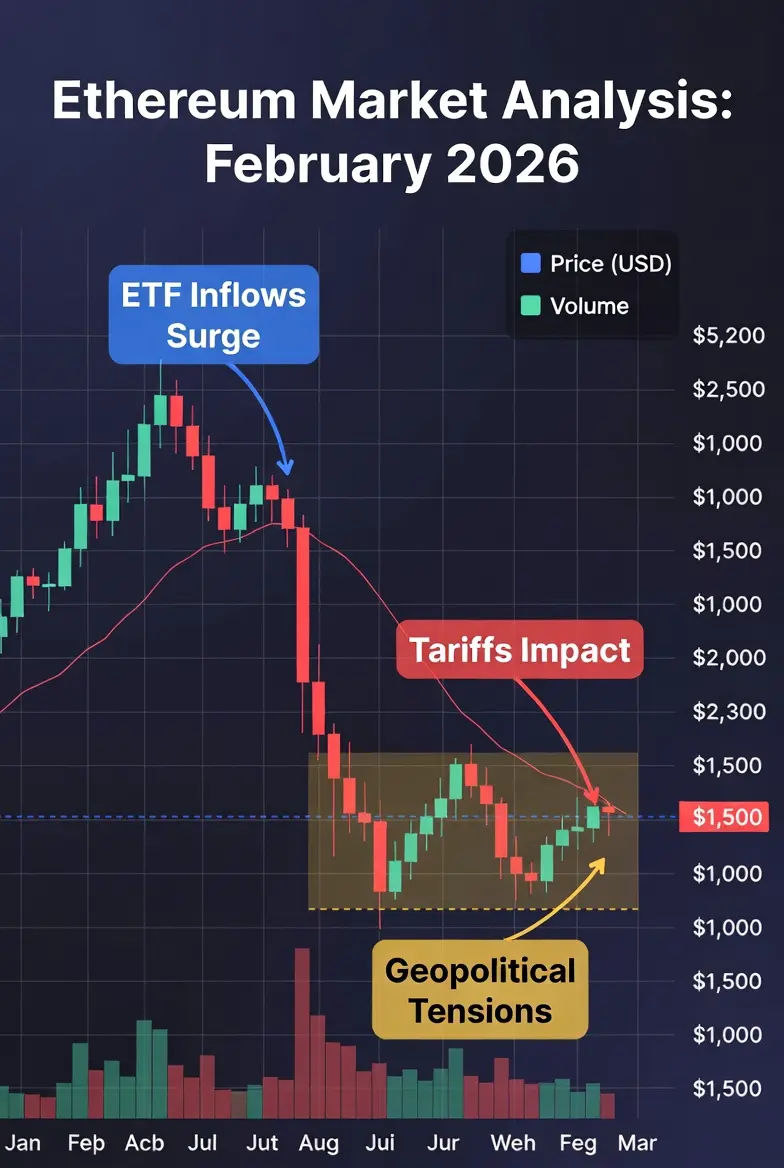
Trump’s 15% Global Tariff Announcement (Feb 23): Instant sell-off across all risk assets. Traders feared higher inflation, slower global growth, and reduced liquidity — classic headwinds for high-beta assets like ETH.
US-Iran Geopolitical Tensions: Massive military buildup (largest since 2003) sent investors fleeing into cash and gold. ETH, still perceived as a “risk-on” play, suffered heavy outflows.
Macro Headwinds & Tech Meltdown: Hotter-than-expected US PPI data, Nvidia earnings miss, and S&P 500 weakness. ETH has shown 70%+ correlation with Nasdaq recently, acting more like leveraged tech than “ultrasound money.”
Leverage Wipeout & Liquidations: Over $1.8 billion in ETH perpetual liquidations in a single weekend. Futures open interest collapsed 25%+, creating a cascading deleveraging event.
Spot ETH ETF Outflows: After record 2025 inflows, US spot Ethereum ETFs flipped to net outflows of ~$2.1 billion in January–February, removing a key institutional bid.
Technical Breakdown: ETH broke below its 200-week moving average (~$2,400) and formed a death cross on the weekly chart — the same pattern that preceded the 2022 bear market.
In summary: a perfect macro + leverage storm. Ethereum’s fundamentals (Pectra upgrade roadmap, restaking growth via EigenLayer, L2 TVL hitting $80B+) are still intact — this was purely a sentiment and liquidity-driven flush.
The Recovery Phase Explained
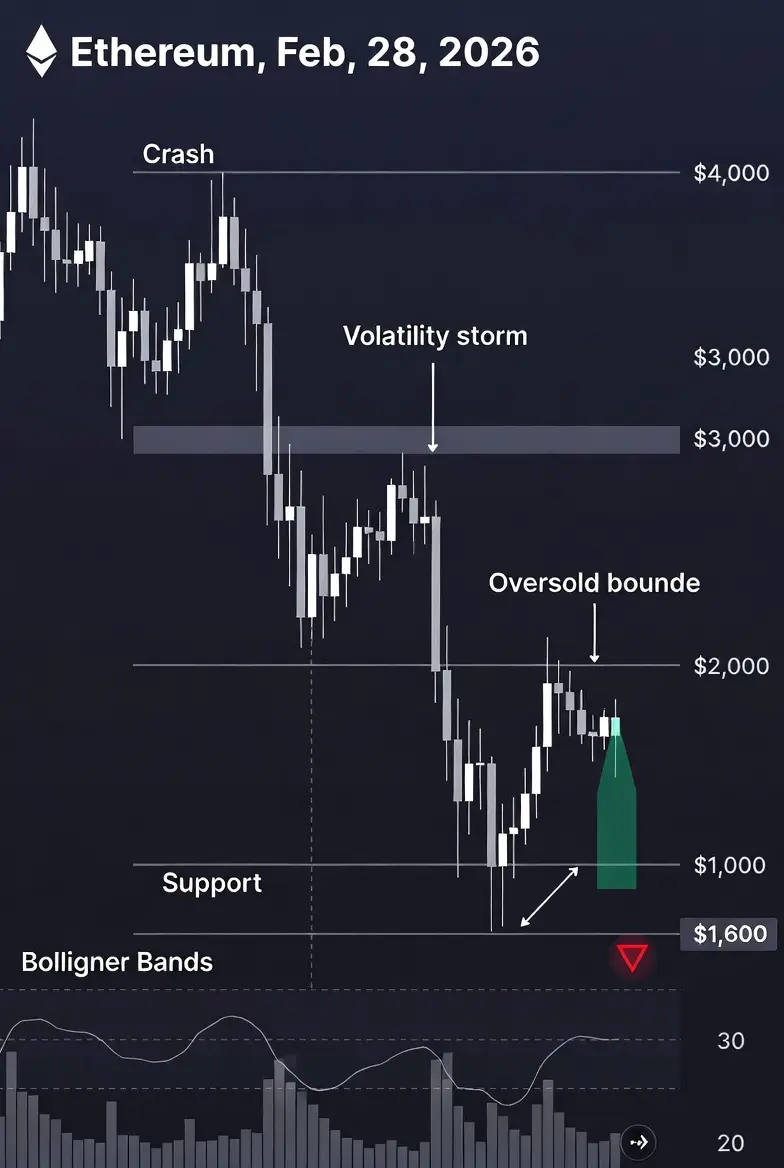
After testing critical support at $1,550–$1,650 (a major 2024–2025 demand zone and 0.618 Fibonacci retracement), Ethereum delivered a classic relief rally:
Gained 15–20% in just days at peaks.
Powered by $180M+ daily spot ETF inflows, RSI hitting extreme oversold levels (<25), and aggressive short covering.
Traders labeled it “the oversold bounce every cycle needs” after weak hands were shaken out.
The price sliced through $1,780 resistance before stalling again at $1,950–$2,000. Weekend macro selling and Bitcoin’s weakness pulled it back. Crypto bounces rarely go straight up — this one will likely need multiple tests and fresh catalysts (Fed pivot signals or tariff de-escalation) to turn into a sustained uptrend.
Price Forecast: Short-Term, Medium-Term, and 2026 Outlook
Analyst opinions are split, but here is the balanced consensus based on on-chain data, ETF flows, and cycle models:
Short-Term (Next 1–4 Weeks): Volatile range trading $1,650–$2,100. Resistance at $2,000 then $2,200–$2,300. Support at $1,750 and $1,600 (break below risks $1,400 fast). Expect retest of $1,900–$2,000 if macro calms.
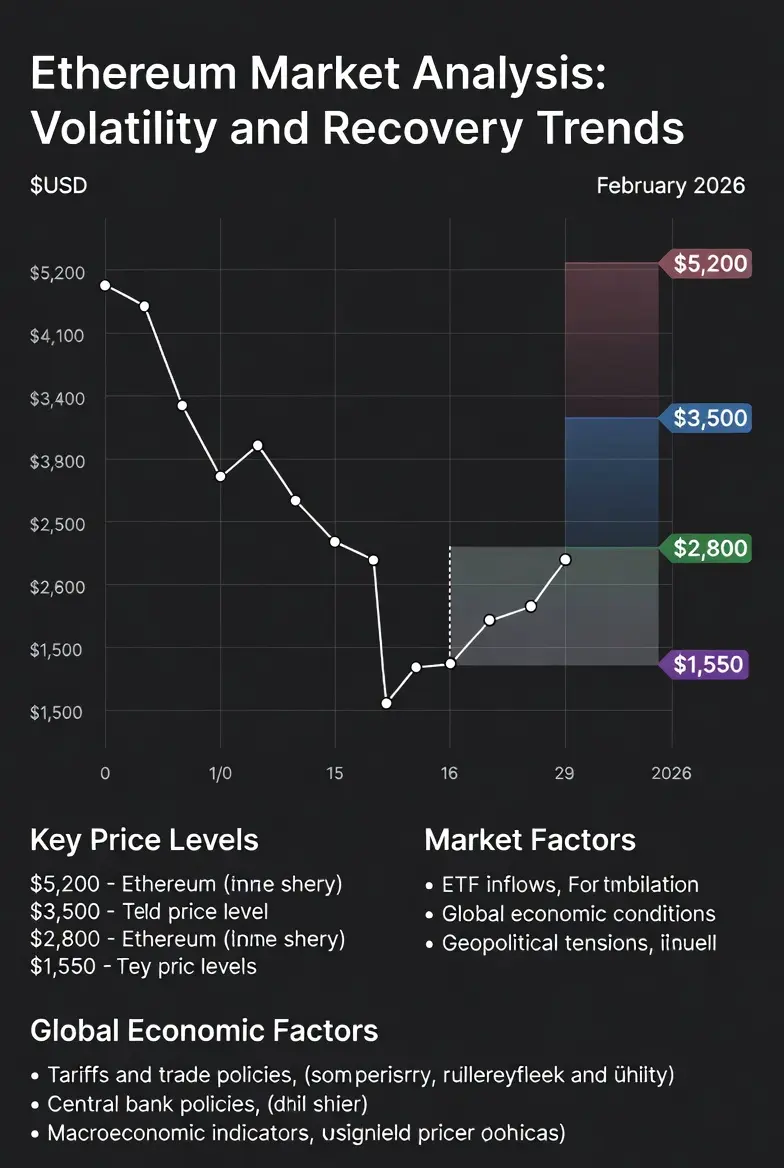
End of 2026: Wide range. Bullish targets $2,800–$3,500 (some analysts calling $4,000–$5,000 if cycle repeats and liquidity returns). Bearish targets $1,200–$1,500 if 2018/2022-style bear market fully plays out. Consensus average: ~$2,800–$3,200 by year-end if recovery sustains.
2027–2030 Longer Term: Strongly constructive. Multiple models (stock-to-flow, ETF adoption curves, L2 scaling) point to $5,000–$10,000+ by 2030, driven by institutional treasury adoption, real-world asset tokenization, and Ethereum’s dominant smart-contract position.
Bottom line: The “worst may still be ahead” according to some cycle charts repeating 2018–2022, but the majority view this as a healthy mid-cycle correction in a multi-year bull market. Macro catalysts will decide the next leg.
Trading Strategies Right Now
The environment is range-bound and macro-driven — here are practical, fully extended strategies:
Long-Term Holders (HODLers & Stakers): Accumulate aggressively below $1,800 via Dollar-Cost Averaging (DCA). Stake on Lido or Rocket Pool for 3–5% real yields while you wait. Ethereum has recovered from 80%+ drawdowns multiple times in its history.
Swing/Short-Term Traders: Trade the range. Buy dips near $1,700–$1,750 with tight stops below $1,650; target $2,000–$2,200 on bounces. Use RSI (<30 = long, >70 = short), MACD crossovers, and volume profile. Keep leverage under 5x — recent liquidations proved 20x+ is suicidal.
Technical Setup: $2,000 is the immediate pivot. Sustained break above = bullish. Breakdown below $1,600 = acceleration lower. Watch the ETH/BTC pair closely — strength here signals outperformance.
Risk Management (Non-Negotiable): Risk max 1–2% of portfolio per trade. Always use stop-losses. Keep 30–50% in stablecoins during uncertainty. Track ETF flows (weekly), CME futures positioning, and on-chain metrics (whale accumulation, exchange reserves).
Advanced traders are loading call options for $3,000 strikes by Q3 and using basis trades between spot and futures.
Immediate (Days–Weeks): Wait for clarity on tariffs, Iran situation, and next US inflation print. A clean move above $2,000 with rising ETF inflows could spark a 20–30% rally fast. Failure risks retest of $1,600.
Medium Term (Q2–Q3 2026): If macro stabilizes and Fed signals easing, expect recovery toward $2,800+. Watch for renewed institutional buying (corporate treasuries adding ETH) and L2 TVL explosion as catalysts.
Your Action Plan
Bullish Bias: Stack ETH on every dip under $1,800 and stake it. Long-term story is stronger than ever.
Neutral/Cautious: Stay 40–60% in stablecoins, trade only high-probability range bounces.
Monitor Daily: Spot ETF flows, ETH/BTC ratio, on-chain whale activity, and global risk sentiment.
Ethereum remains the backbone of decentralized finance and the clear leader in smart contracts and real-world adoption. The current bounce is real but still fragile — patience, discipline, and strong risk management will separate winners from the rest in 2026.
Ethereum has been caught in the same brutal volatility storm as the broader crypto market in early 2026. After riding the 2025 bull wave to fresh all-time highs above $4,800–$5,200 (peaking around September–October 2025 alongside Bitcoin’s surge), ETH crashed hard, dropping over 60% to lows near $1,550–$1,650 in mid-February. The asset is now clawing its way back toward the $1,850 zone, fueled by ETF inflows, oversold technicals, and short covering — but the recovery remains fragile and choppy, with fresh selling pressure today dragging prices lower once again.
Current Ethereum Price (Live as of February 28, 2026)
Current Price: Approximately $1,850 – $1,865 USD (fluctuating; CoinMarketCap showing ~$1,852, CoinDesk ~$1,858 at latest check).
24h Change: Down ~6.2–6.8%, with 24h range of $1,820 low to $1,980 high.
Market Cap: ~$222 billion.
24h Trading Volume: ~$28 billion.
Key Context: ETH is down ~62% from its October 2025 all-time high of $5,198. It bounced sharply from sub-$1,600 levels earlier this month but is struggling at resistance near $2,000–$2,100. The market is stuck in a wide $1,600–$2,200 range, extremely sensitive to macro headlines and Bitcoin’s movement (ETH/BTC pair currently hovering near 0.029).
Why Did the Market Fall So Low? (Reasons for the February 2026 Crash)
Ethereum’s collapse was not driven by any Ethereum-specific failure (Layer-2 scaling, Dencun upgrade effects, and staking yields remain strong). Instead, it was dragged down by the exact same risk-off macro storm that crushed Bitcoin and equities:
Trump’s 15% Global Tariff Announcement (Feb 23): Instant sell-off across all risk assets. Traders feared higher inflation, slower global growth, and reduced liquidity — classic headwinds for high-beta assets like ETH.
US-Iran Geopolitical Tensions: Massive military buildup (largest since 2003) sent investors fleeing into cash and gold. ETH, still perceived as a “risk-on” play, suffered heavy outflows.
Macro Headwinds & Tech Meltdown: Hotter-than-expected US PPI data, Nvidia earnings miss, and S&P 500 weakness. ETH has shown 70%+ correlation with Nasdaq recently, acting more like leveraged tech than “ultrasound money.”
Leverage Wipeout & Liquidations: Over $1.8 billion in ETH perpetual liquidations in a single weekend. Futures open interest collapsed 25%+, creating a cascading deleveraging event.
Spot ETH ETF Outflows: After record 2025 inflows, US spot Ethereum ETFs flipped to net outflows of ~$2.1 billion in January–February, removing a key institutional bid.
Technical Breakdown: ETH broke below its 200-week moving average (~$2,400) and formed a death cross on the weekly chart — the same pattern that preceded the 2022 bear market.
In summary: a perfect macro + leverage storm. Ethereum’s fundamentals (Pectra upgrade roadmap, restaking growth via EigenLayer, L2 TVL hitting $80B+) are still intact — this was purely a sentiment and liquidity-driven flush.
The Recovery Phase Explained
After testing critical support at $1,550–$1,650 (a major 2024–2025 demand zone and 0.618 Fibonacci retracement), Ethereum delivered a classic relief rally:
Gained 15–20% in just days at peaks.
Powered by $180M+ daily spot ETF inflows, RSI hitting extreme oversold levels (<25), and aggressive short covering.
Traders labeled it “the oversold bounce every cycle needs” after weak hands were shaken out.
The price sliced through $1,780 resistance before stalling again at $1,950–$2,000. Weekend macro selling and Bitcoin’s weakness pulled it back. Crypto bounces rarely go straight up — this one will likely need multiple tests and fresh catalysts (Fed pivot signals or tariff de-escalation) to turn into a sustained uptrend.
Price Forecast: Short-Term, Medium-Term, and 2026 Outlook
Analyst opinions are split, but here is the balanced consensus based on on-chain data, ETF flows, and cycle models:
Short-Term (Next 1–4 Weeks): Volatile range trading $1,650–$2,100. Resistance at $2,000 then $2,200–$2,300. Support at $1,750 and $1,600 (break below risks $1,400 fast). Expect retest of $1,900–$2,000 if macro calms.
End of 2026: Wide range. Bullish targets $2,800–$3,500 (some analysts calling $4,000–$5,000 if cycle repeats and liquidity returns). Bearish targets $1,200–$1,500 if 2018/2022-style bear market fully plays out. Consensus average: ~$2,800–$3,200 by year-end if recovery sustains.
2027–2030 Longer Term: Strongly constructive. Multiple models (stock-to-flow, ETF adoption curves, L2 scaling) point to $5,000–$10,000+ by 2030, driven by institutional treasury adoption, real-world asset tokenization, and Ethereum’s dominant smart-contract position.
Bottom line: The “worst may still be ahead” according to some cycle charts repeating 2018–2022, but the majority view this as a healthy mid-cycle correction in a multi-year bull market. Macro catalysts will decide the next leg.
Trading Strategies Right Now
The environment is range-bound and macro-driven — here are practical, fully extended strategies:
Long-Term Holders (HODLers & Stakers): Accumulate aggressively below $1,800 via Dollar-Cost Averaging (DCA). Stake on Lido or Rocket Pool for 3–5% real yields while you wait. Ethereum has recovered from 80%+ drawdowns multiple times in its history.
Swing/Short-Term Traders: Trade the range. Buy dips near $1,700–$1,750 with tight stops below $1,650; target $2,000–$2,200 on bounces. Use RSI (<30 = long, >70 = short), MACD crossovers, and volume profile. Keep leverage under 5x — recent liquidations proved 20x+ is suicidal.
Technical Setup: $2,000 is the immediate pivot. Sustained break above = bullish. Breakdown below $1,600 = acceleration lower. Watch the ETH/BTC pair closely — strength here signals outperformance.
Risk Management (Non-Negotiable): Risk max 1–2% of portfolio per trade. Always use stop-losses. Keep 30–50% in stablecoins during uncertainty. Track ETF flows (weekly), CME futures positioning, and on-chain metrics (whale accumulation, exchange reserves).
Advanced traders are loading call options for $3,000 strikes by Q3 and using basis trades between spot and futures.
Immediate (Days–Weeks): Wait for clarity on tariffs, Iran situation, and next US inflation print. A clean move above $2,000 with rising ETF inflows could spark a 20–30% rally fast. Failure risks retest of $1,600.
Medium Term (Q2–Q3 2026): If macro stabilizes and Fed signals easing, expect recovery toward $2,800+. Watch for renewed institutional buying (corporate treasuries adding ETH) and L2 TVL explosion as catalysts.
Your Action Plan
Bullish Bias: Stack ETH on every dip under $1,800 and stake it. Long-term story is stronger than ever.
Neutral/Cautious: Stay 40–60% in stablecoins, trade only high-probability range bounces.
Monitor Daily: Spot ETF flows, ETH/BTC ratio, on-chain whale activity, and global risk sentiment.
Ethereum remains the backbone of decentralized finance and the clear leader in smart contracts and real-world adoption. The current bounce is real but still fragile — patience, discipline, and strong risk management will separate winners from the rest in 2026.