

GateUser-62b6814c
No content yet
- Reward
- 1
- Comment
- Share
- Reward
- like
- Comment
- Share
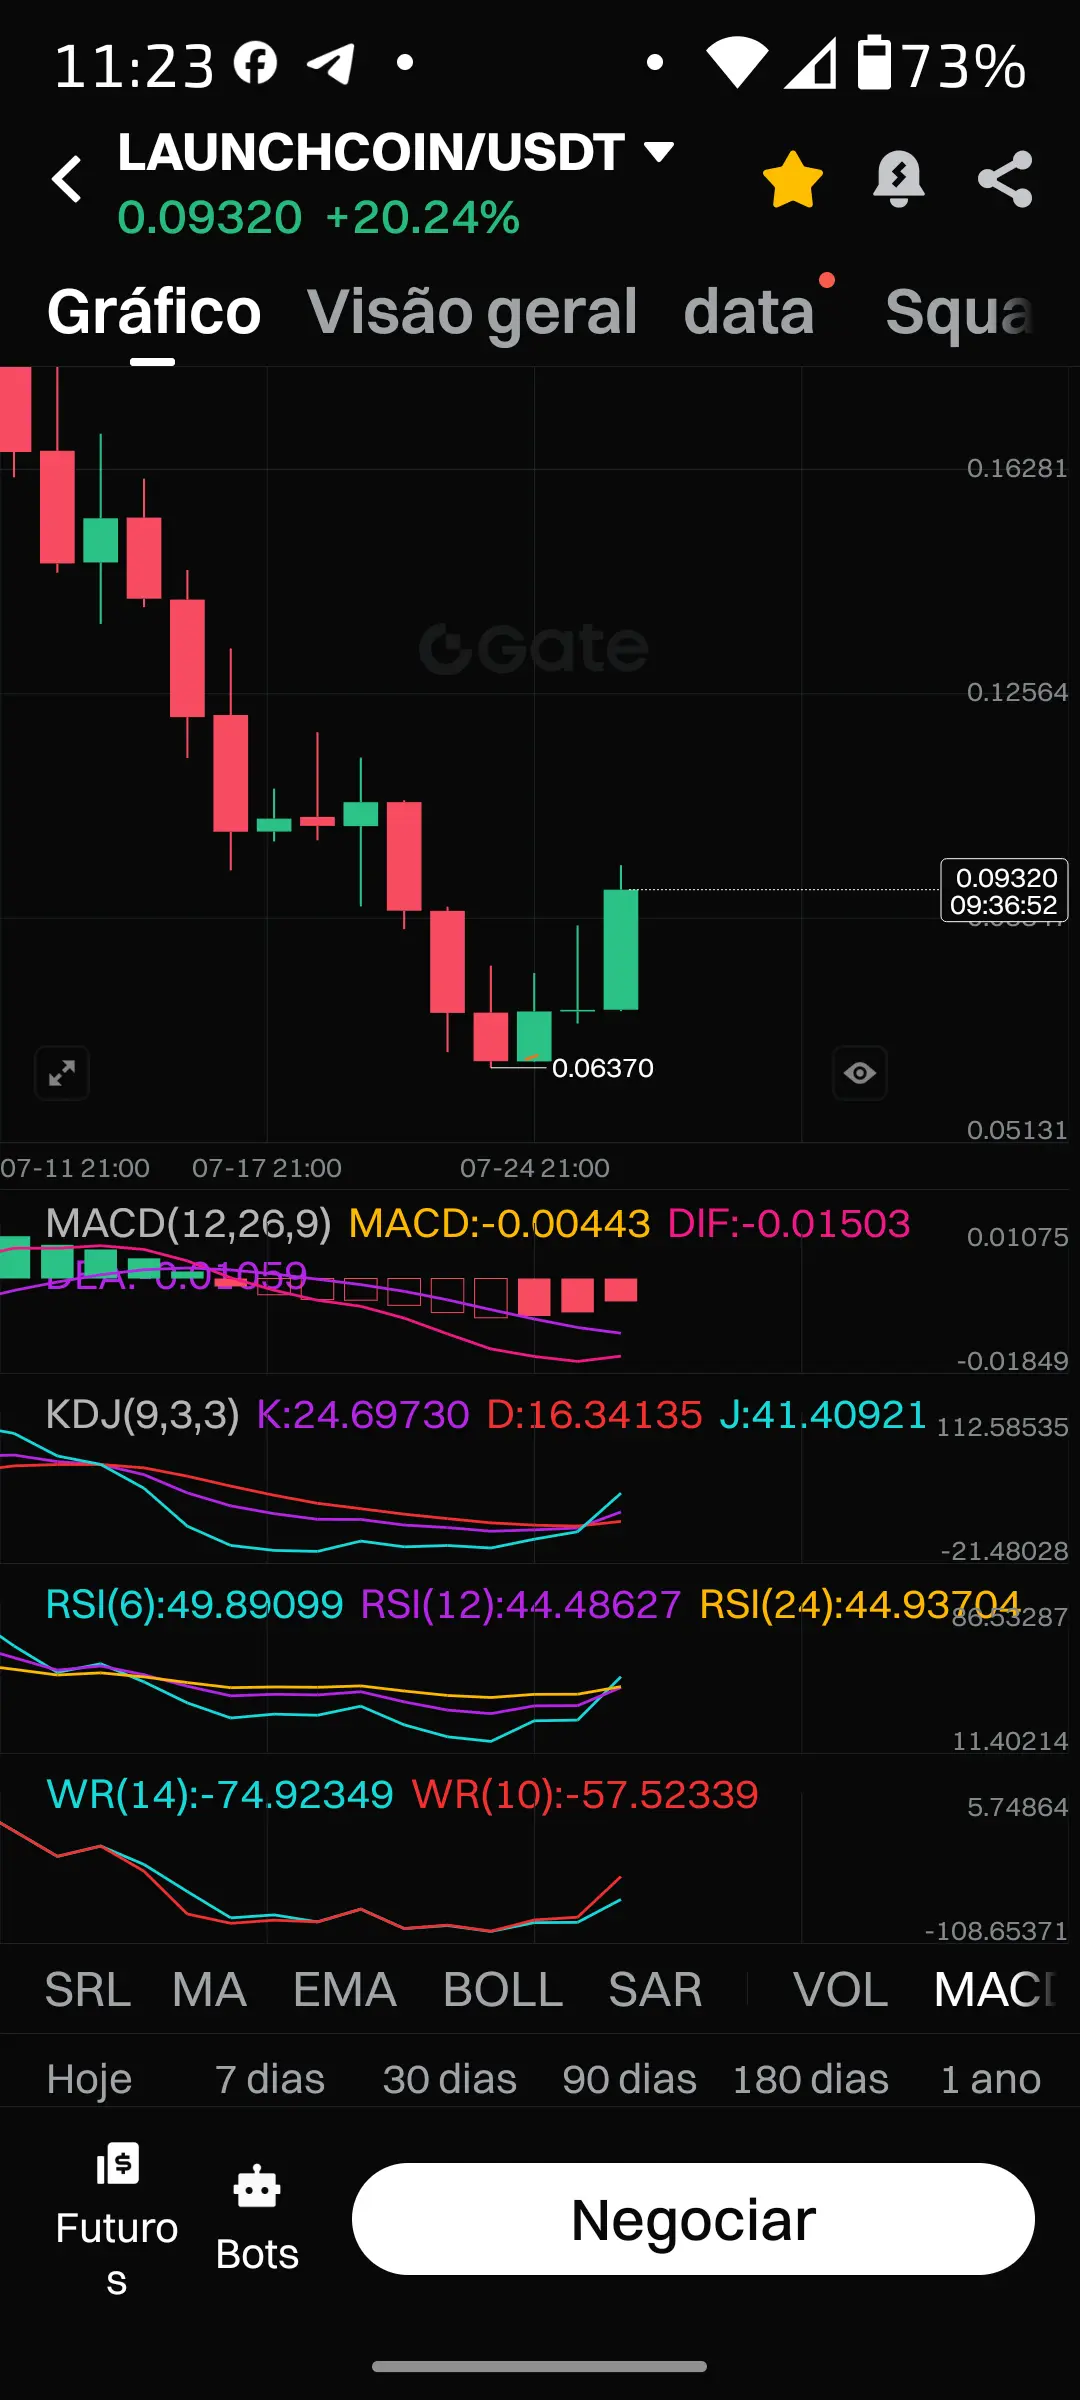
#LAUNCHCOIN# has no reason to sell now, look at the chart and the indicators are rising 🤝👍🚀🐂📈💣
LAUNCHCOIN0.75%
- Reward
- like
- Comment
- Share
#LAUNCHCOIN# don't sell now the daily is recovering well the indicators are gaining strength 💵📈🐂🛒💵
LAUNCHCOIN0.75%
- Reward
- 1
- Comment
- Share
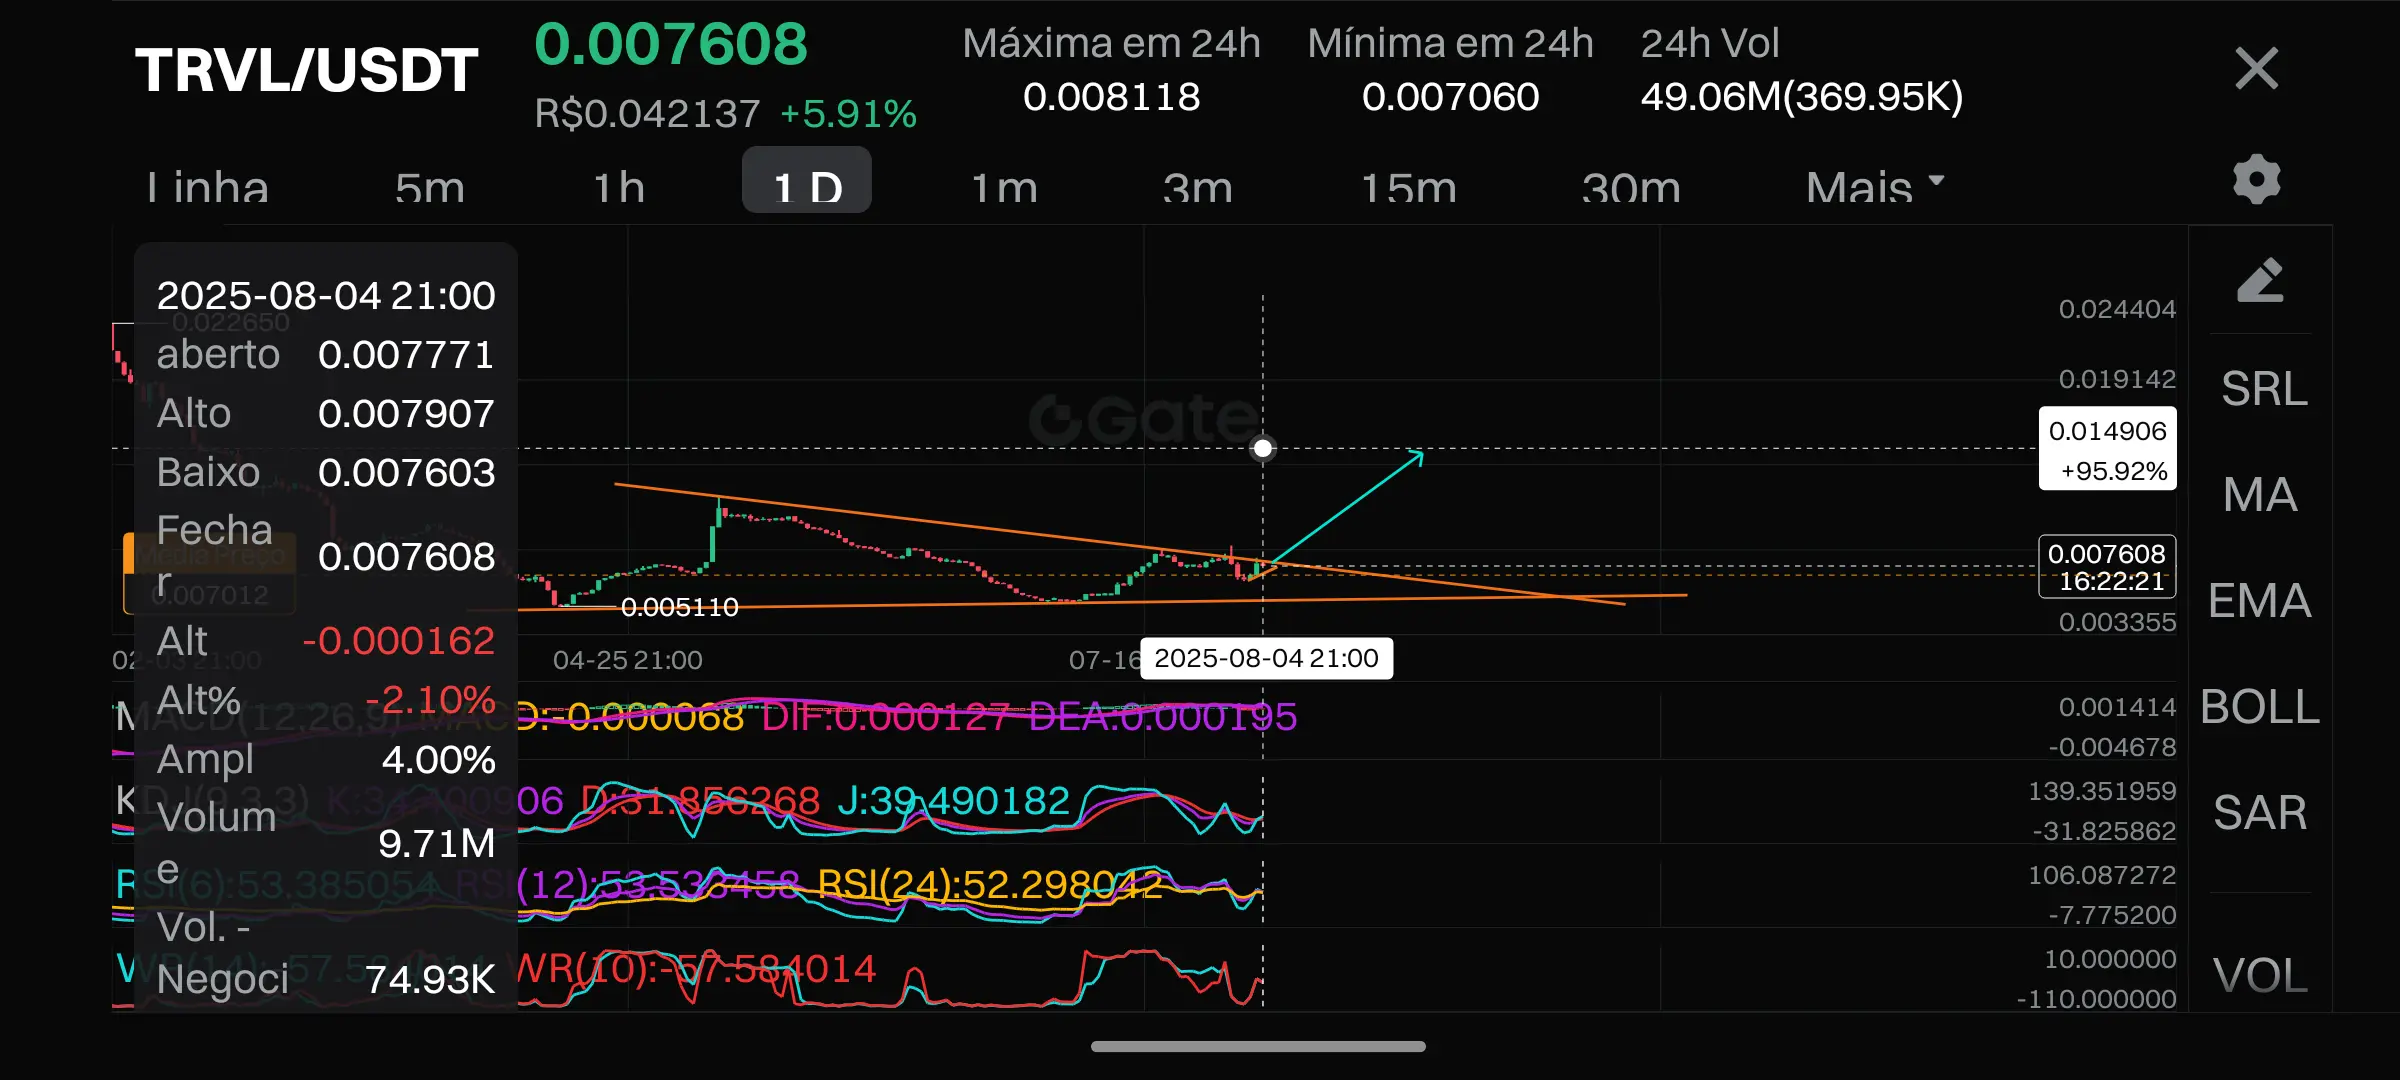
#LAUNCHCOIN# keep in the wallet for a little longer the indicators are turning positive
LAUNCHCOIN0.75%
POR1.77%
- Reward
- 3
- Comment
- Share
- Reward
- like
- Comment
- Share
- Reward
- like
- Comment
- Share
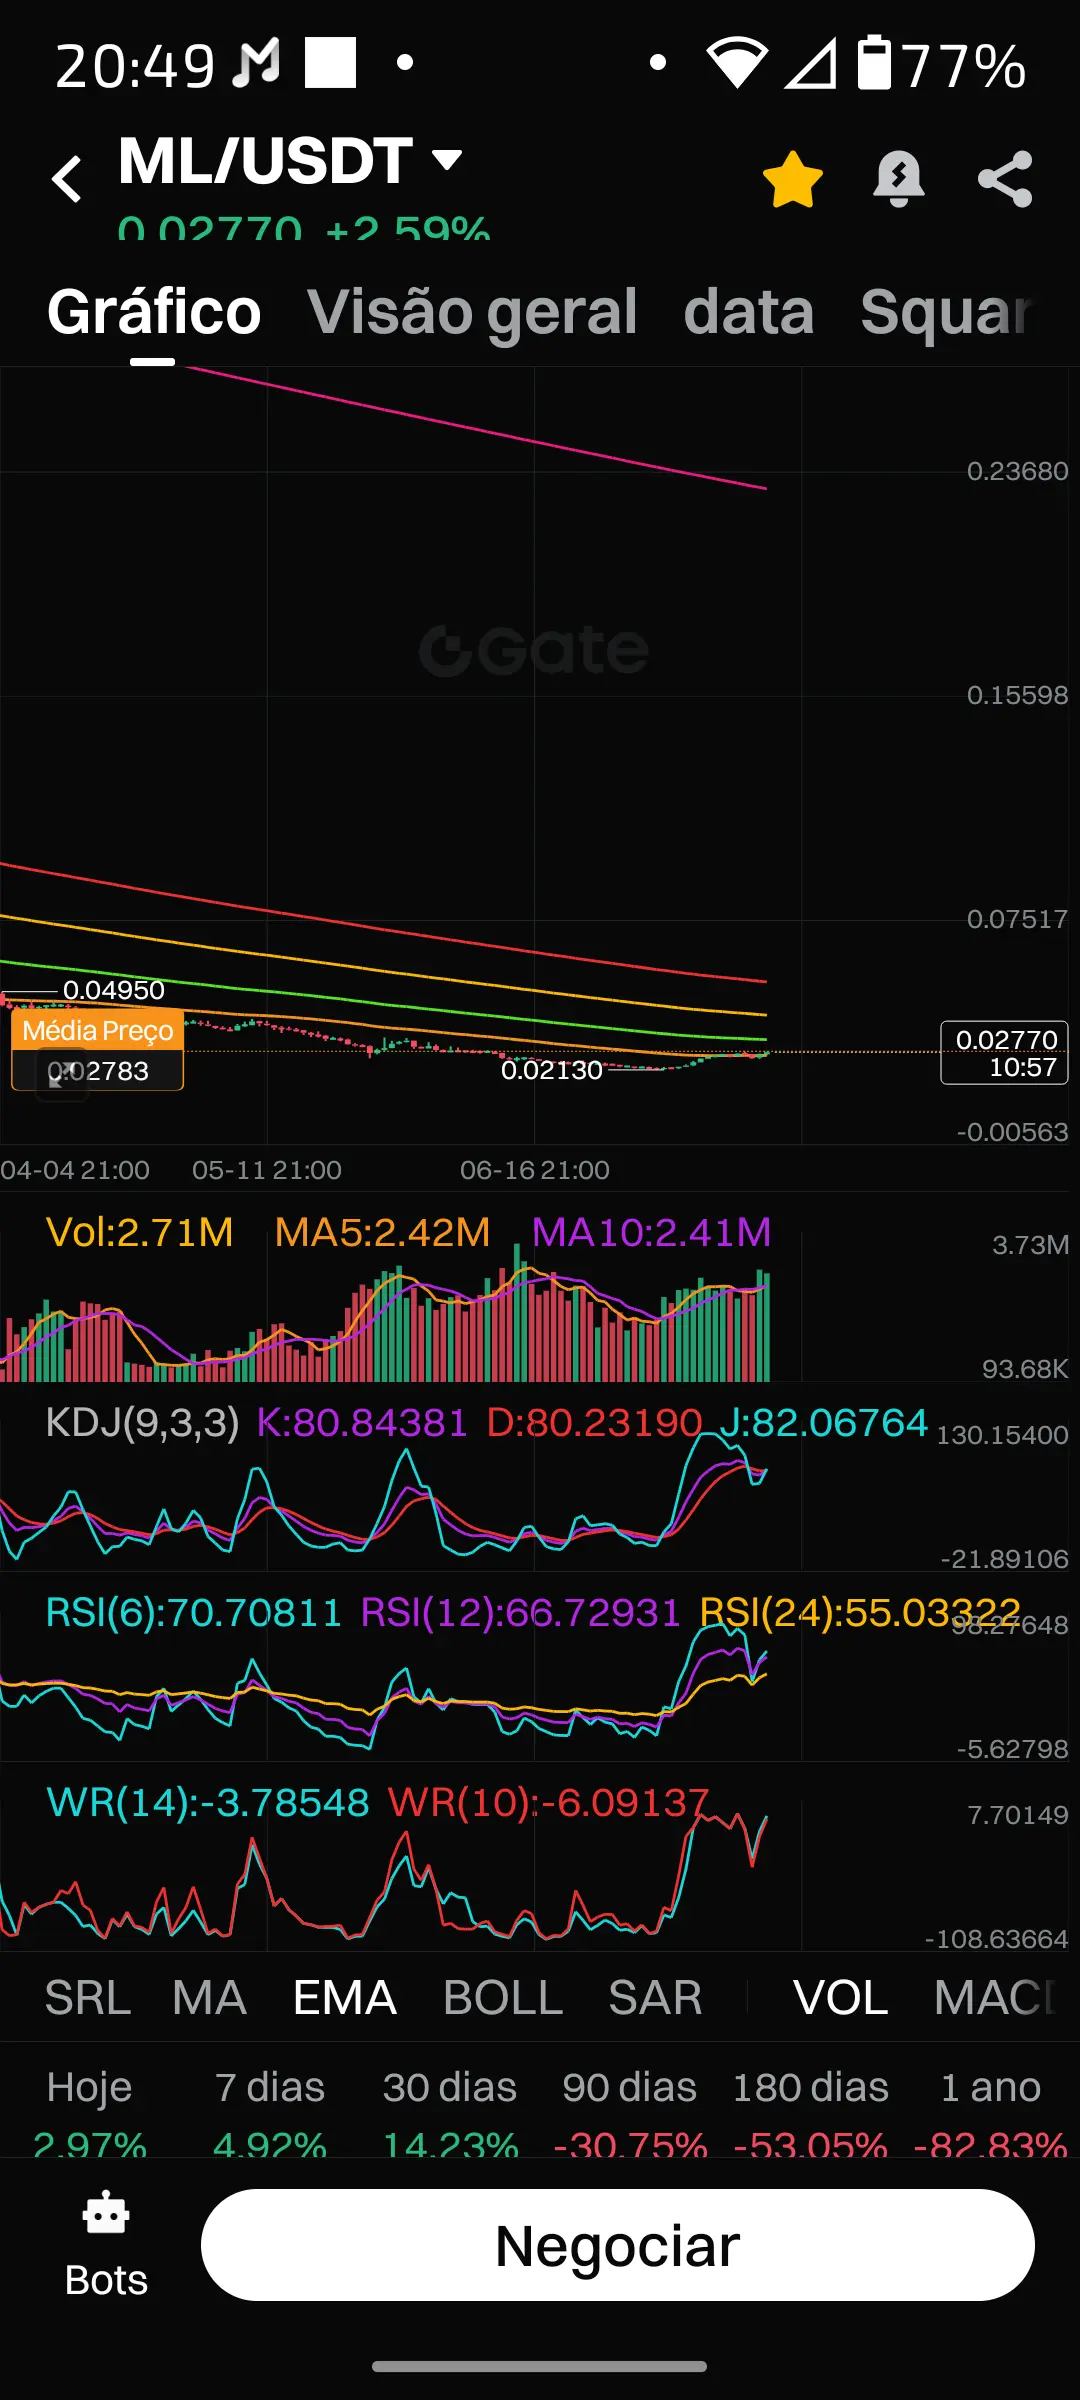
#NAWS# Daily RSI varies from 0 to 100, with readings above 70 generally indicating overbought conditions ( potentially overvalued asset, with possible price correction ), while readings below 30 indicate oversold conditions ( potentially undervalued asset, with possible buying opportunity ).
The calculation of the IFR involves comparing the average gains with the average losses over a certain period (usually 14 days).
View OriginalThe calculation of the IFR involves comparing the average gains with the average losses over a certain period (usually 14 days).
- Reward
- like
- Comment
- Share
- Reward
- like
- 1
- Share
GateUser-da13d4db :
:
Do you want to buy it?- Reward
- like
- Comment
- Share
#VERT# vertus and #u2unetwork# are ready to pump hard monthly chart 📈💵🚀💣🐂🛒 fill the cart now let's go
VERT-0.01%
- Reward
- 1
- Comment
- Share
- Reward
- like
- Comment
- Share
- Reward
- like
- Comment
- Share
- Reward
- like
- Comment
- Share
#STARDOGE# Yes, waiting can be rewarded. This is a common idea in various cultures and contexts, reflecting the belief that patience and persistence in the face of waiting can lead to positive and gratifying outcomes.
View Original- Reward
- like
- Comment
- Share
- Reward
- like
- Comment
- Share
- Reward
- like
- Comment
- Share
#YESP# Discipline and Patience:
Follow your investment plan and avoid making impulsive decisions based on news or market trends.
Invest regularly and maintain discipline, even during times of market volatility.
Be patient, as investment results usually appear in the long term.
View OriginalFollow your investment plan and avoid making impulsive decisions based on news or market trends.
Invest regularly and maintain discipline, even during times of market volatility.
Be patient, as investment results usually appear in the long term.
- Reward
- like
- Comment
- Share