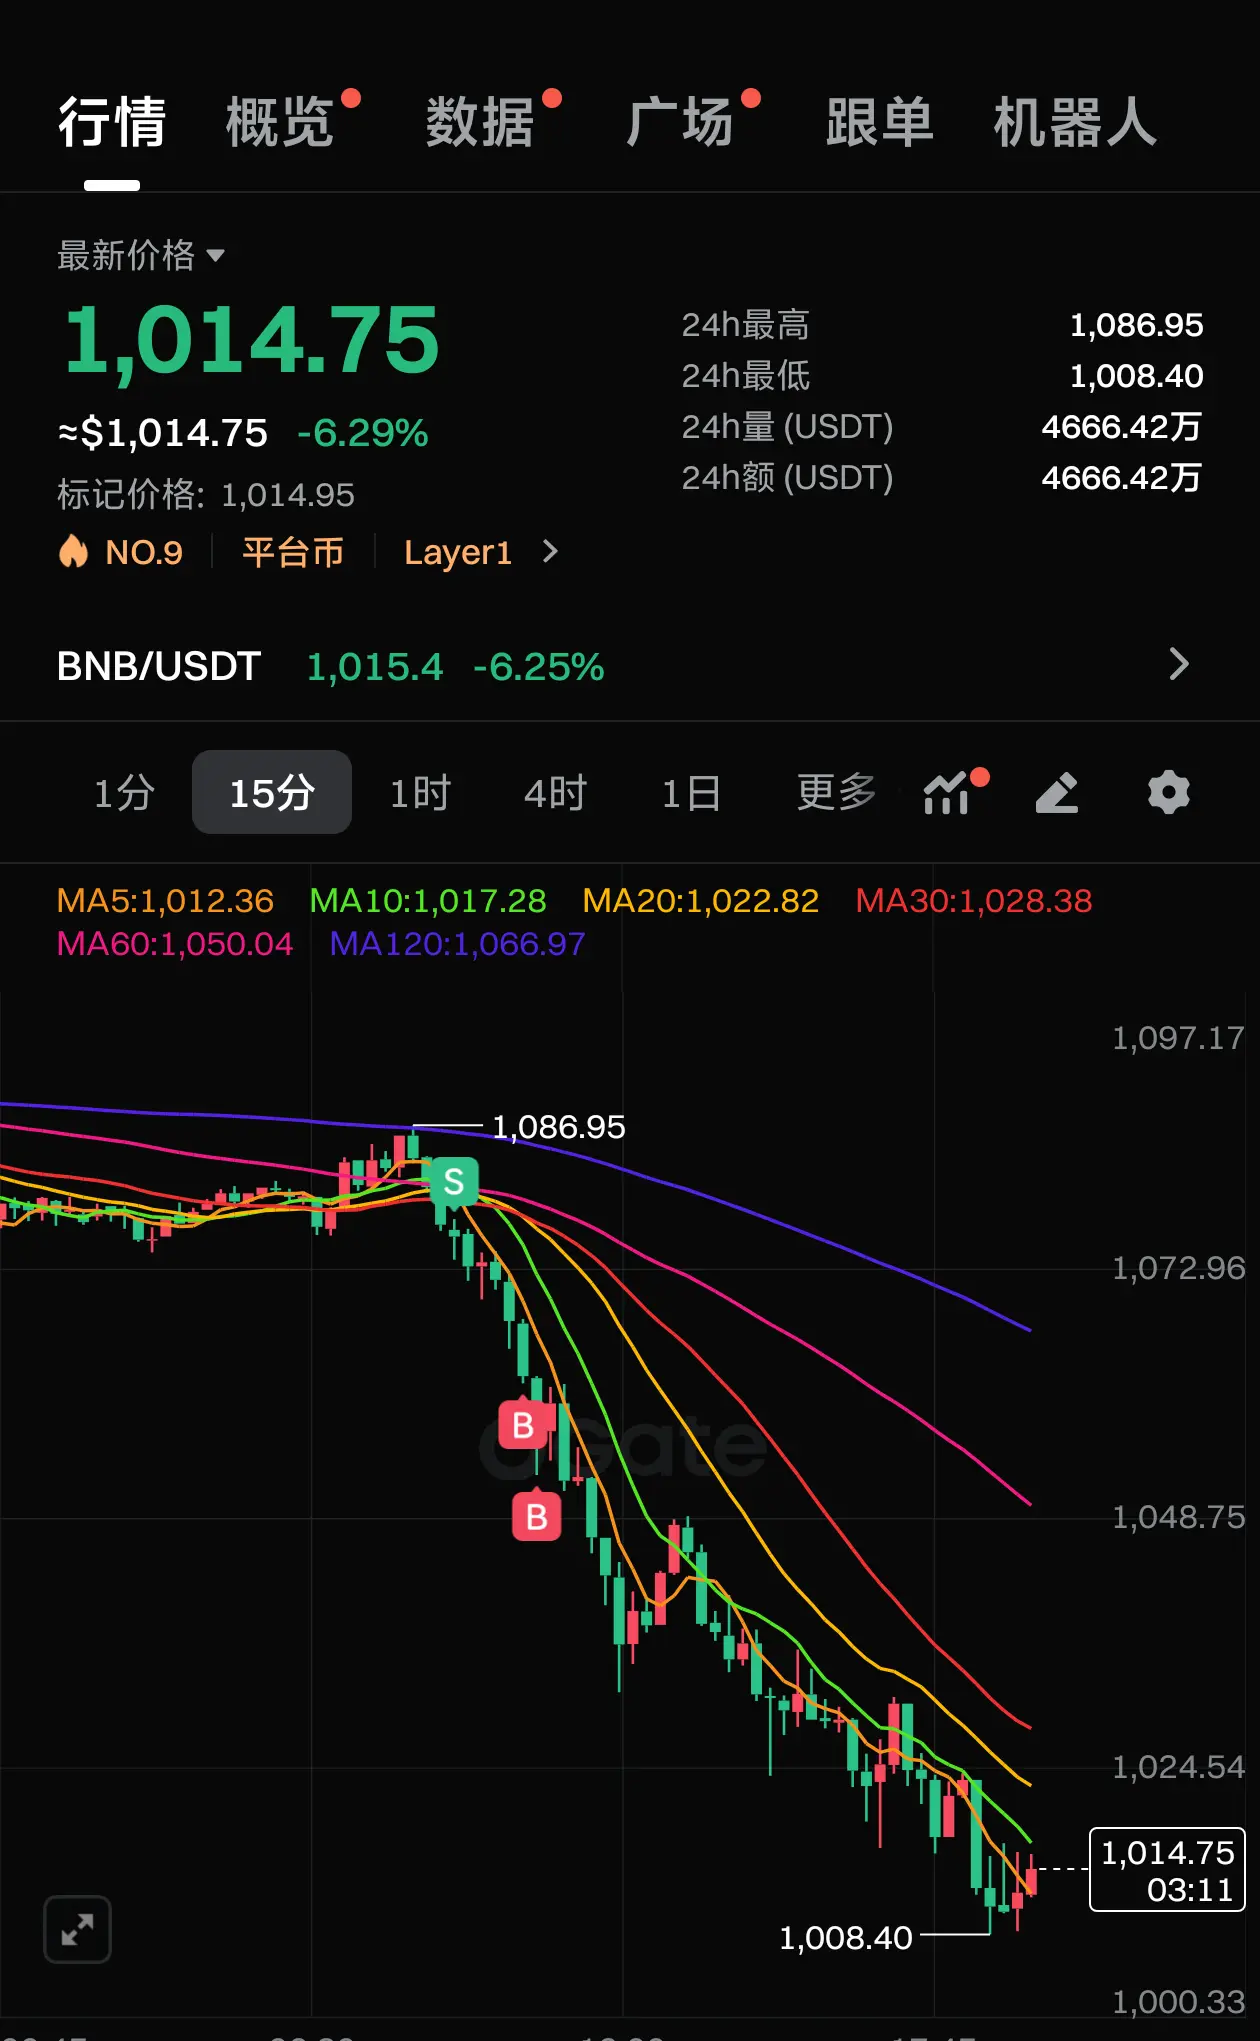
BNB experienced a surge and then a pullback in the early morning of November 10th, with the price falling from the $1018 level to around $1013 and fluctuating. According to four-hour technical analysis, BNB's price is currently approaching the upper Bollinger Band, indicating that resistance above is relatively strong and bullish momentum is weakening. The Bollinger Band indicator suggests that short-term upward space may be limited, and the market may face correction pressure.
Operationally, it is recommended to adopt a mainly bearish strategy based on rebounds. Consider short positions in th
Operationally, it is recommended to adopt a mainly bearish strategy based on rebounds. Consider short positions in th
BTC1.46%
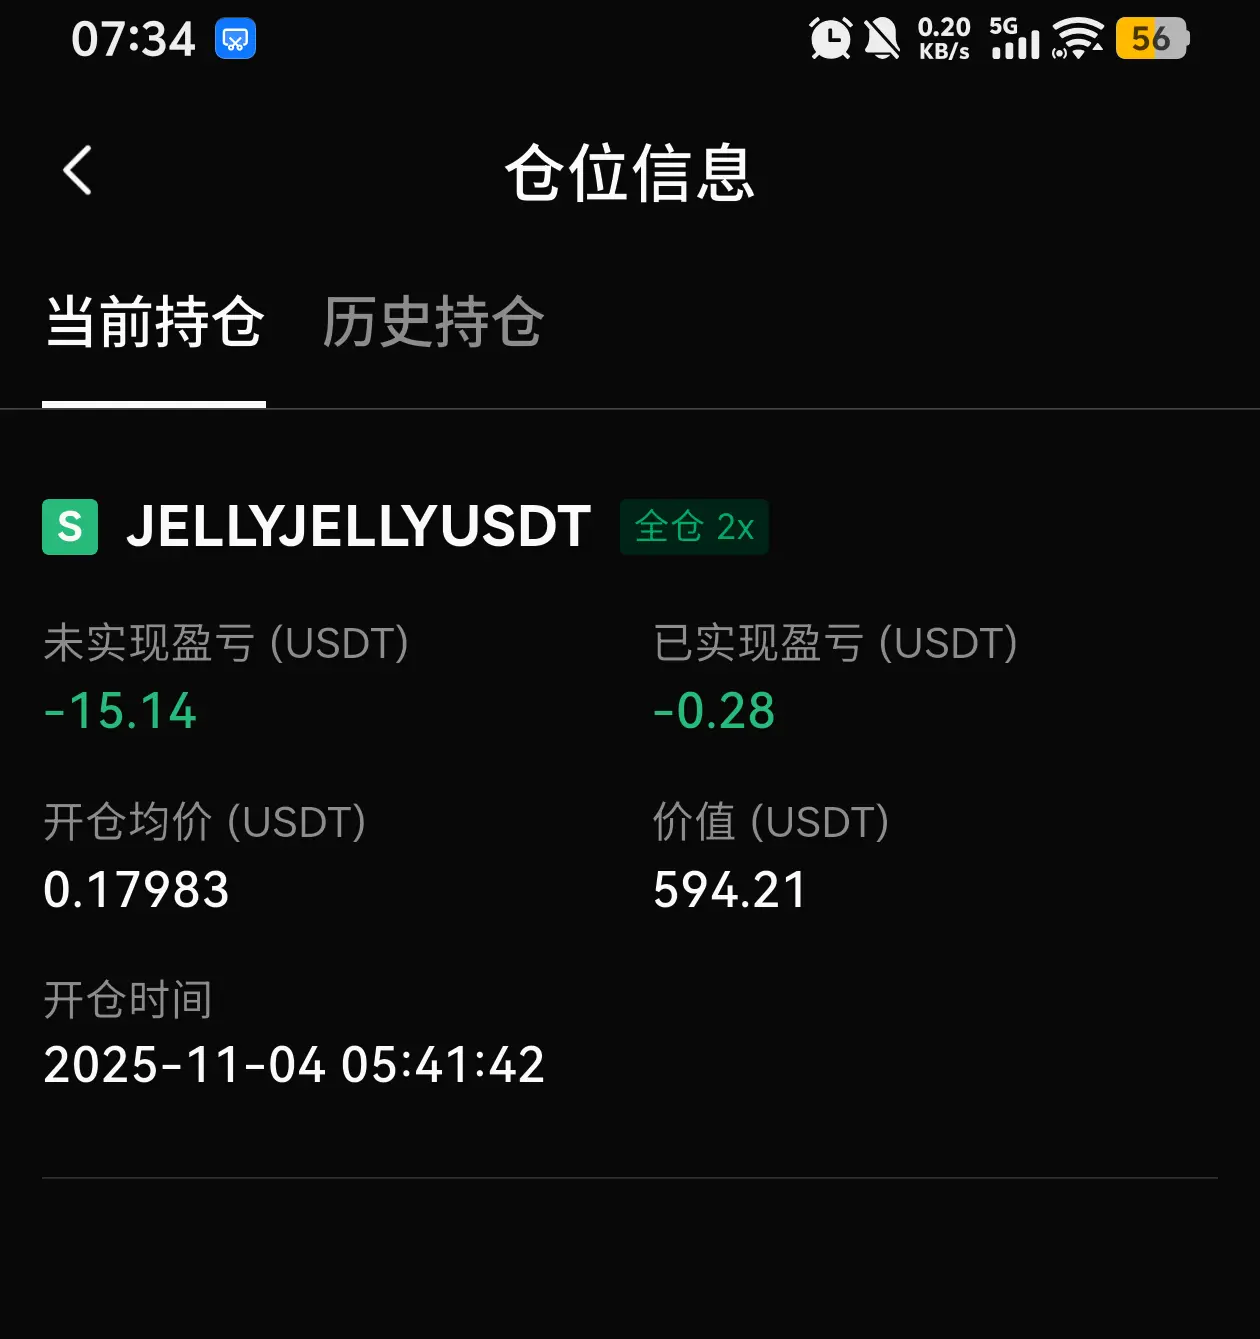
[The user has shared his/her trading data. Go to the App to view more.]