#BTCBreaks82000
Bitcoin is currently transitioning through one of its most critical decision zones of the mid-2026 cycle. The market is not simply reacting to price movement — it is responding to structural liquidity shifts, leveraged positioning resets, and sustained institutional accumulation.
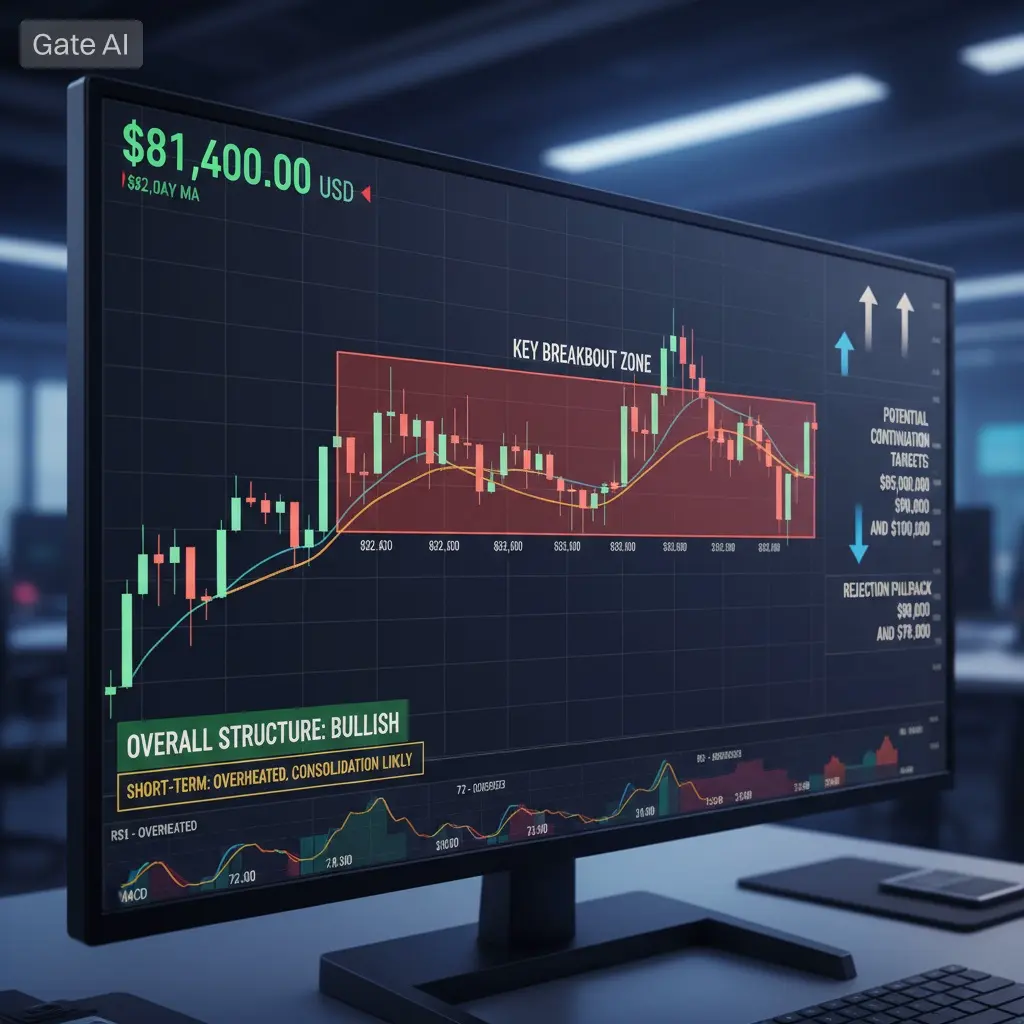
The recent move toward $82,474 represents a liquidity breakout attempt from a multi-week compression range, followed by a controlled pullback toward the $81.4K region. This type of price action is typically associated with early expansion phases in macro bull cycles, where volatility increases but trend direction is not yet fully confirmed.
Current BTC Market Snapshot (May 2026)
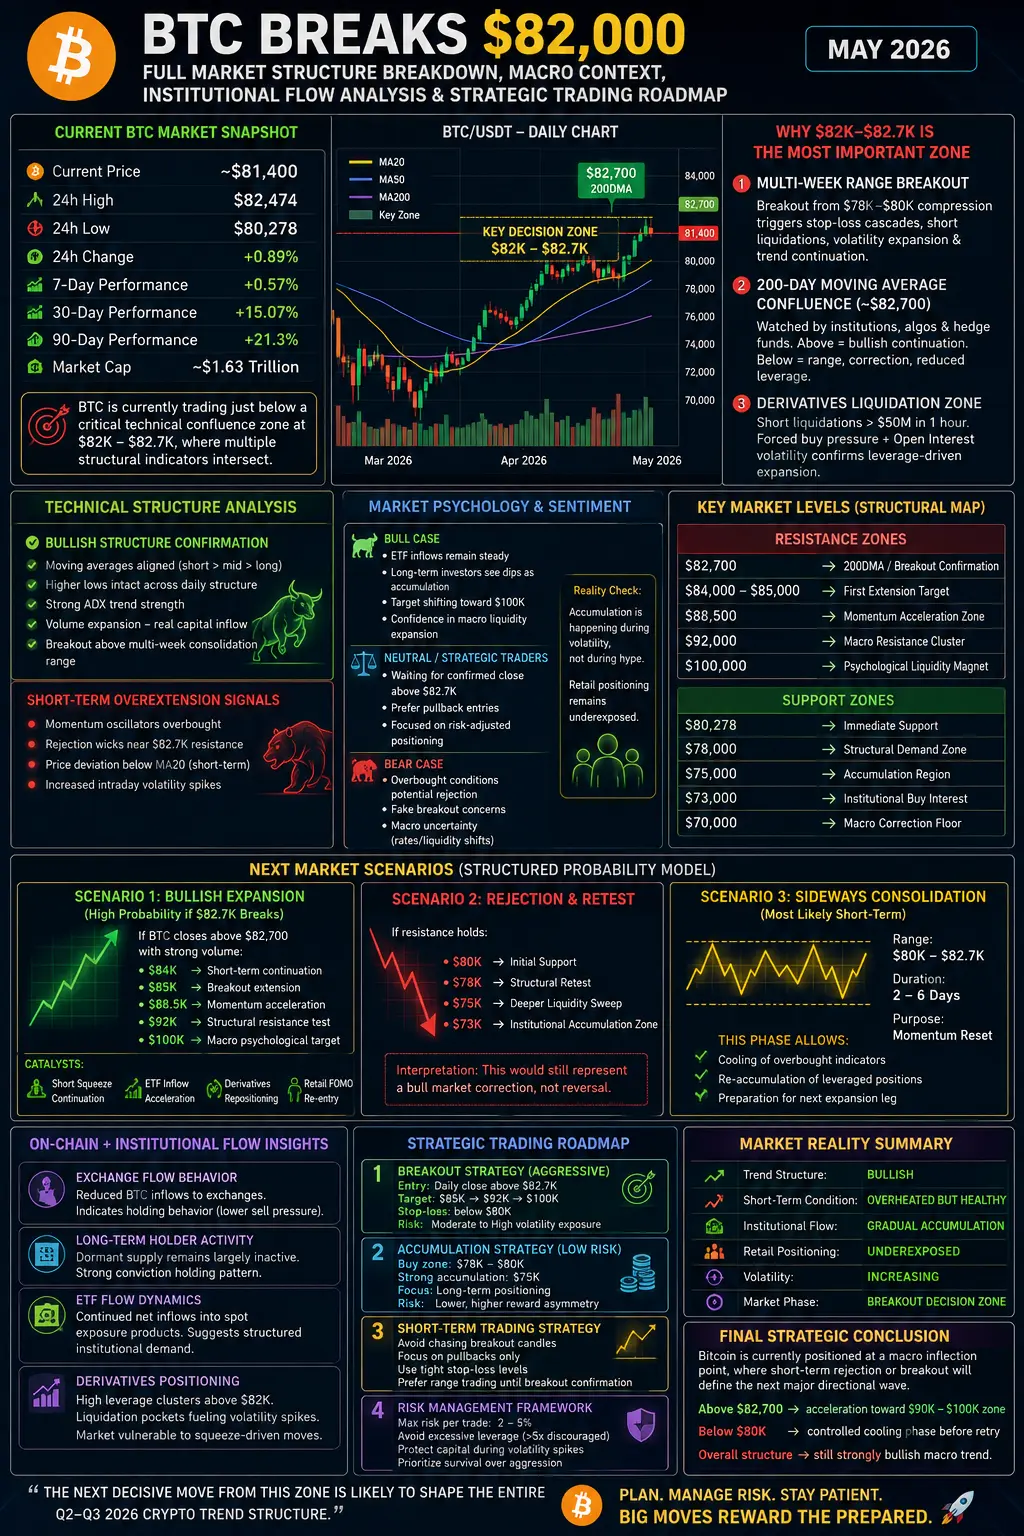
Current Price: ~$81,400
24h High: $82,474 (key breakout attempt zone)
24h Low: $80,278
24h Change: +0.89%
7-Day Performance: +0.57%
30-Day Performance: +15.07%
90-Day Performance: +21.3%
Market Cap: ~$1.63 Trillion
BTC is currently trading just below a critical technical confluence zone at $82K–$82.7K, where multiple structural indicators intersect.
WHY $82K–$82.7K IS THE MOST IMPORTANT ZONE IN THE ENTIRE MARKET STRUCTURE
This range is not random resistance — it is a multi-factor decision cluster.
1. Multi-Week Range Breakout Boundary
Bitcoin was previously compressed between $78K–$80K, forming a liquidity coil.
Breakouts from such zones typically trigger:
Stop-loss cascades above resistance
Forced short liquidation
Volatility expansion phases
Trend continuation acceleration
This is not breakout “noise” — it is market structure expansion.
2. 200-Day Moving Average Confluence (~$82,700)
The 200-day moving average is widely used by:
Institutional funds
Algorithmic trading systems
Macro hedge funds
A sustained move above this level historically signals:
Transition into bullish continuation phase
Increased long-term capital inflows
Reduction in downside volatility regime
A rejection below this level often leads to:
Range-bound consolidation
Short-term correction cycles
Reduced leverage exposure from institutions
3. Derivatives Liquidation Trigger Zone
Recent price action caused:
Short liquidations exceeding ~$50M in under an hour
Forced buy pressure during breakout wick
Increase in open interest volatility
This confirms the move was not purely spot-driven — it was leverage-driven expansion, a key signature of early breakout phases.
TECHNICAL STRUCTURE ANALYSIS
Bullish Structure Confirmation
Moving averages aligned bullishly (short > mid > long trend alignment)
Higher lows still intact across daily structure
Strong ADX trend strength indicates real momentum, not fake pump
Volume expansion confirms participation from larger capital pools
Breakout above multi-week consolidation range
Interpretation:
The market is in a bull trend continuation phase, not reversal.
Short-Term Overextension Signals
Despite bullish structure, short-term exhaustion is visible:
Momentum oscillators showing overbought conditions
Rejection wicks near $82.7K resistance
Short-term deviation below MA20
Increased intraday volatility spikes
Interpretation:
This is a healthy cooling phase inside an active uptrend, not trend failure.
MARKET PSYCHOLOGY & SENTIMENT STRUCTURE
Bull Case Psychology
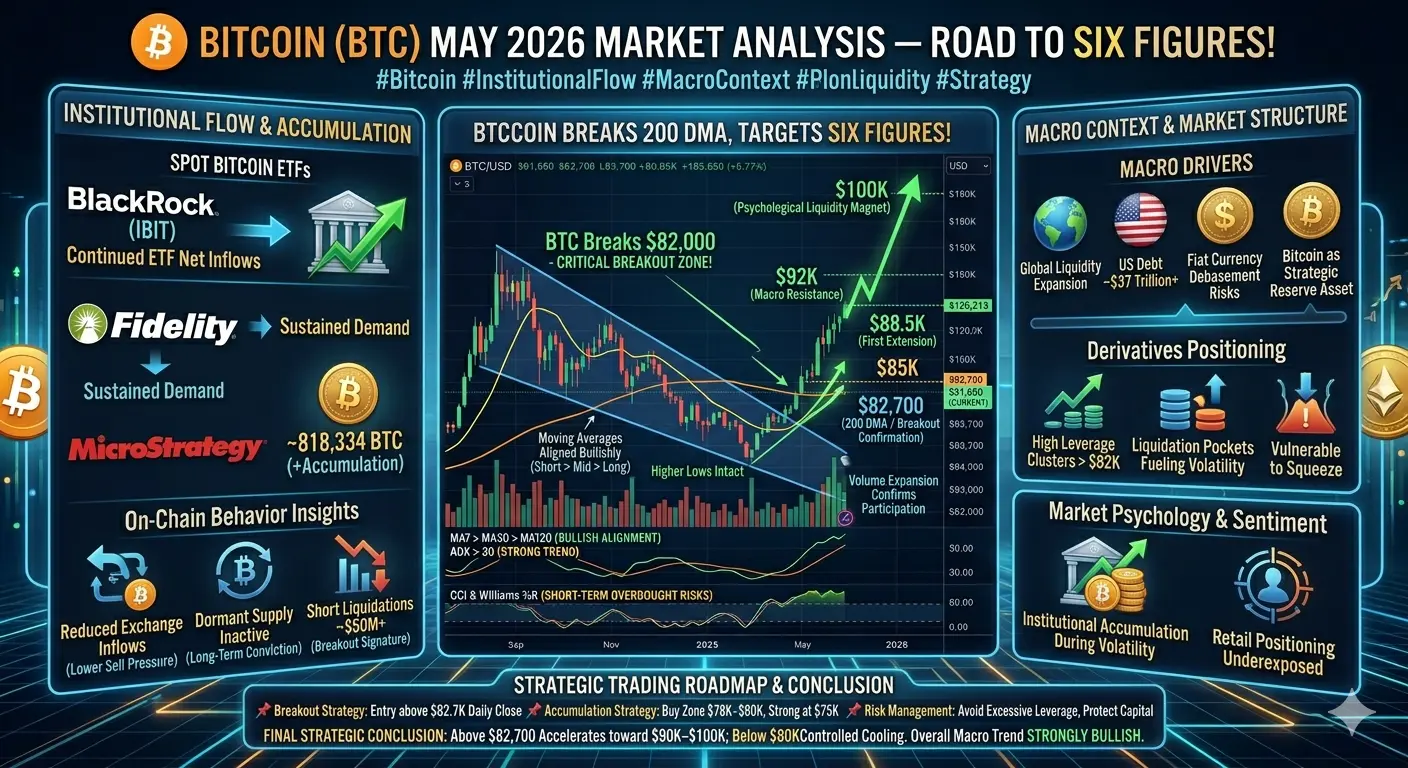
ETF inflows remain steady
Long-term investors view dips as accumulation
Psychological target shifting toward $100K
Confidence in macro liquidity expansion
Neutral / Strategic Traders
Waiting for confirmed close above $82.7K
Prefer pullback entries instead of breakout chasing
Focused on risk-adjusted positioning
Bear Case Narrative
Overbought conditions = potential rejection
Fake breakout concerns remain
Macro uncertainty (rates/liquidity shifts)
📌 Reality Check:
Institutional behavior suggests:
Accumulation is happening during volatility, not during hype.
Retail positioning remains comparatively underexposed.
KEY MARKET LEVELS (STRUCTURAL MAP)
Resistance Zones
$82,700 → 200DMA / breakout confirmation
$84,000–$85,000 → first extension target
$88,500 → momentum acceleration zone
$92,000 → macro resistance cluster
$100,000 → psychological liquidity magnet
Support Zones
$80,278 → immediate support
$78,000 → structural demand zone
$75,000 → accumulation region
$73,000 → institutional buy interest
$70,000 → macro correction floor
NEXT MARKET SCENARIOS (STRUCTURED PROBABILITY MODEL)
Scenario 1: Bullish Expansion (High Probability if $82.7K Breaks)
If BTC closes above $82,700 with strong volume confirmation:
$84K → short-term continuation
$85K → breakout extension
$88.5K → momentum acceleration
$92K → structural resistance test
$100K → macro psychological target
Catalysts:
Short squeeze continuation
ETF inflow acceleration
Derivatives repositioning
Retail FOMO re-entry phase
Scenario 2: Rejection & Retest
If resistance holds:
$80K → initial support
$78K → structural retest
$75K → deeper liquidity sweep
$73K → institutional accumulation zone
Interpretation:
This would still represent a bull market correction, not reversal.
Scenario 3: Sideways Consolidation (Most Likely Short-Term)
BTC may consolidate:
Range: $80K – $82.7K
Duration: 2–6 days
Purpose: momentum reset
This phase allows:
Cooling of overbought indicators
Re-accumulation of leveraged positions
Preparation for next expansion leg
ON-CHAIN + INSTITUTIONAL FLOW INSIGHTS
4. Exchange Flow Behavior
Reduced BTC inflows to exchanges
Indicates holding behavior (lower sell pressure)
5. Long-Term Holder Activity
Dormant supply remains largely inactive
Strong conviction holding pattern
6. ETF Flow Dynamics
Continued net inflows into spot exposure products
Suggests structured institutional demand
7. Derivatives Positioning
High leverage clusters above $82K
Liquidation pockets fueling volatility spikes
Market vulnerable to squeeze-driven moves
STRATEGIC TRADING ROADMAP
1. Breakout Strategy (Aggressive)
Entry: Daily close above $82.7K
Target: $85K → $92K → $100K
Stop-loss: below $80K
Risk: Moderate to High volatility exposure
2. Accumulation Strategy (Low Risk)
Buy zone: $78K–$80K
Strong accumulation: $75K
Focus: long-term positioning
Risk: Lower, higher reward asymmetry
3. Short-Term Trading Strategy
Avoid chasing breakout candles
Focus on pullbacks only
Use tight stop-loss levels
Prefer range trading until breakout confirmation
4. Risk Management Framework
Maximum risk per trade: 2–5%
Avoid excessive leverage (>5x discouraged)
Protect capital during volatility spikes
Prioritize survival over aggression
MARKET REALITY SUMMARY
Trend structure: Bullish
Short-term condition: Overheated but healthy
Institutional flow: Gradual accumulation
Retail positioning: Underexposed
Volatility: Increasing
Market phase: Breakout decision zone
FINAL STRATEGIC CONCLUSION
Bitcoin is currently positioned at a macro inflection point, where short-term rejection or breakout will define the next major directional wave.
Key takeaway:
Above $82,700 → acceleration toward $90K–$100K zone
Below $80K → controlled cooling phase before retry
Overall structure → still strongly bullish macro trend
The most important dynamic is not price alone — but liquidity behavior, institutional accumulation patterns, and leverage positioning across derivatives markets.
The next decisive move from this zone is likely to shape the entire Q2–Q3 2026 crypto trend structure.
Bitcoin is currently transitioning through one of its most critical decision zones of the mid-2026 cycle. The market is not simply reacting to price movement — it is responding to structural liquidity shifts, leveraged positioning resets, and sustained institutional accumulation.
The recent move toward $82,474 represents a liquidity breakout attempt from a multi-week compression range, followed by a controlled pullback toward the $81.4K region. This type of price action is typically associated with early expansion phases in macro bull cycles, where volatility increases but trend direction is not yet fully confirmed.
Current BTC Market Snapshot (May 2026)
Current Price: ~$81,400
24h High: $82,474 (key breakout attempt zone)
24h Low: $80,278
24h Change: +0.89%
7-Day Performance: +0.57%
30-Day Performance: +15.07%
90-Day Performance: +21.3%
Market Cap: ~$1.63 Trillion
BTC is currently trading just below a critical technical confluence zone at $82K–$82.7K, where multiple structural indicators intersect.
WHY $82K–$82.7K IS THE MOST IMPORTANT ZONE IN THE ENTIRE MARKET STRUCTURE
This range is not random resistance — it is a multi-factor decision cluster.
1. Multi-Week Range Breakout Boundary
Bitcoin was previously compressed between $78K–$80K, forming a liquidity coil.
Breakouts from such zones typically trigger:
Stop-loss cascades above resistance
Forced short liquidation
Volatility expansion phases
Trend continuation acceleration
This is not breakout “noise” — it is market structure expansion.
2. 200-Day Moving Average Confluence (~$82,700)
The 200-day moving average is widely used by:
Institutional funds
Algorithmic trading systems
Macro hedge funds
A sustained move above this level historically signals:
Transition into bullish continuation phase
Increased long-term capital inflows
Reduction in downside volatility regime
A rejection below this level often leads to:
Range-bound consolidation
Short-term correction cycles
Reduced leverage exposure from institutions
3. Derivatives Liquidation Trigger Zone
Recent price action caused:
Short liquidations exceeding ~$50M in under an hour
Forced buy pressure during breakout wick
Increase in open interest volatility
This confirms the move was not purely spot-driven — it was leverage-driven expansion, a key signature of early breakout phases.
TECHNICAL STRUCTURE ANALYSIS
Bullish Structure Confirmation
Moving averages aligned bullishly (short > mid > long trend alignment)
Higher lows still intact across daily structure
Strong ADX trend strength indicates real momentum, not fake pump
Volume expansion confirms participation from larger capital pools
Breakout above multi-week consolidation range
Interpretation:
The market is in a bull trend continuation phase, not reversal.
Short-Term Overextension Signals
Despite bullish structure, short-term exhaustion is visible:
Momentum oscillators showing overbought conditions
Rejection wicks near $82.7K resistance
Short-term deviation below MA20
Increased intraday volatility spikes
Interpretation:
This is a healthy cooling phase inside an active uptrend, not trend failure.
MARKET PSYCHOLOGY & SENTIMENT STRUCTURE
Bull Case Psychology
ETF inflows remain steady
Long-term investors view dips as accumulation
Psychological target shifting toward $100K
Confidence in macro liquidity expansion
Neutral / Strategic Traders
Waiting for confirmed close above $82.7K
Prefer pullback entries instead of breakout chasing
Focused on risk-adjusted positioning
Bear Case Narrative
Overbought conditions = potential rejection
Fake breakout concerns remain
Macro uncertainty (rates/liquidity shifts)
📌 Reality Check:
Institutional behavior suggests:
Accumulation is happening during volatility, not during hype.
Retail positioning remains comparatively underexposed.
KEY MARKET LEVELS (STRUCTURAL MAP)
Resistance Zones
$82,700 → 200DMA / breakout confirmation
$84,000–$85,000 → first extension target
$88,500 → momentum acceleration zone
$92,000 → macro resistance cluster
$100,000 → psychological liquidity magnet
Support Zones
$80,278 → immediate support
$78,000 → structural demand zone
$75,000 → accumulation region
$73,000 → institutional buy interest
$70,000 → macro correction floor
NEXT MARKET SCENARIOS (STRUCTURED PROBABILITY MODEL)
Scenario 1: Bullish Expansion (High Probability if $82.7K Breaks)
If BTC closes above $82,700 with strong volume confirmation:
$84K → short-term continuation
$85K → breakout extension
$88.5K → momentum acceleration
$92K → structural resistance test
$100K → macro psychological target
Catalysts:
Short squeeze continuation
ETF inflow acceleration
Derivatives repositioning
Retail FOMO re-entry phase
Scenario 2: Rejection & Retest
If resistance holds:
$80K → initial support
$78K → structural retest
$75K → deeper liquidity sweep
$73K → institutional accumulation zone
Interpretation:
This would still represent a bull market correction, not reversal.
Scenario 3: Sideways Consolidation (Most Likely Short-Term)
BTC may consolidate:
Range: $80K – $82.7K
Duration: 2–6 days
Purpose: momentum reset
This phase allows:
Cooling of overbought indicators
Re-accumulation of leveraged positions
Preparation for next expansion leg
ON-CHAIN + INSTITUTIONAL FLOW INSIGHTS
4. Exchange Flow Behavior
Reduced BTC inflows to exchanges
Indicates holding behavior (lower sell pressure)
5. Long-Term Holder Activity
Dormant supply remains largely inactive
Strong conviction holding pattern
6. ETF Flow Dynamics
Continued net inflows into spot exposure products
Suggests structured institutional demand
7. Derivatives Positioning
High leverage clusters above $82K
Liquidation pockets fueling volatility spikes
Market vulnerable to squeeze-driven moves
STRATEGIC TRADING ROADMAP
1. Breakout Strategy (Aggressive)
Entry: Daily close above $82.7K
Target: $85K → $92K → $100K
Stop-loss: below $80K
Risk: Moderate to High volatility exposure
2. Accumulation Strategy (Low Risk)
Buy zone: $78K–$80K
Strong accumulation: $75K
Focus: long-term positioning
Risk: Lower, higher reward asymmetry
3. Short-Term Trading Strategy
Avoid chasing breakout candles
Focus on pullbacks only
Use tight stop-loss levels
Prefer range trading until breakout confirmation
4. Risk Management Framework
Maximum risk per trade: 2–5%
Avoid excessive leverage (>5x discouraged)
Protect capital during volatility spikes
Prioritize survival over aggression
MARKET REALITY SUMMARY
Trend structure: Bullish
Short-term condition: Overheated but healthy
Institutional flow: Gradual accumulation
Retail positioning: Underexposed
Volatility: Increasing
Market phase: Breakout decision zone
FINAL STRATEGIC CONCLUSION
Bitcoin is currently positioned at a macro inflection point, where short-term rejection or breakout will define the next major directional wave.
Key takeaway:
Above $82,700 → acceleration toward $90K–$100K zone
Below $80K → controlled cooling phase before retry
Overall structure → still strongly bullish macro trend
The most important dynamic is not price alone — but liquidity behavior, institutional accumulation patterns, and leverage positioning across derivatives markets.
The next decisive move from this zone is likely to shape the entire Q2–Q3 2026 crypto trend structure.