Date: Sun, Dec 28, 2025 | 09:40 AM GMT
The broader cryptocurrency market is showing modest strength, with both Bitcoin (BTC) and Ethereum (ETH) trading in the green. This steady performance among major assets has helped stabilize overall sentiment, allowing select memecoins — including SPX6900 (SPX) — to begin showing constructive technical setups.
SPX is trading with a modest intraday gain, but more importantly, its price structure is starting to reflect a classic bullish reversal pattern. After weeks of sustained downside pressure, buyers appear to be stepping back in at key levels, hinting that the worst of the correction may already be behind.

Source: Coinmarketcap
Double Bottom Pattern in Play
On the daily timeframe, SPX is forming a double bottom pattern — a widely followed bullish reversal structure that often appears near the end of prolonged downtrends. The first bottom formed in November when SPX dropped toward the $0.45 region, followed by a recovery that carried price back toward the neckline resistance near $0.7389 in early December.
That recovery attempt, however, was rejected, sending SPX back down to retest the same $0.45 support zone. Importantly, sellers failed to push price meaningfully lower on this second attempt. Instead, SPX printed another strong reaction from the same demand area and has since rebounded to trade around $0.5045.
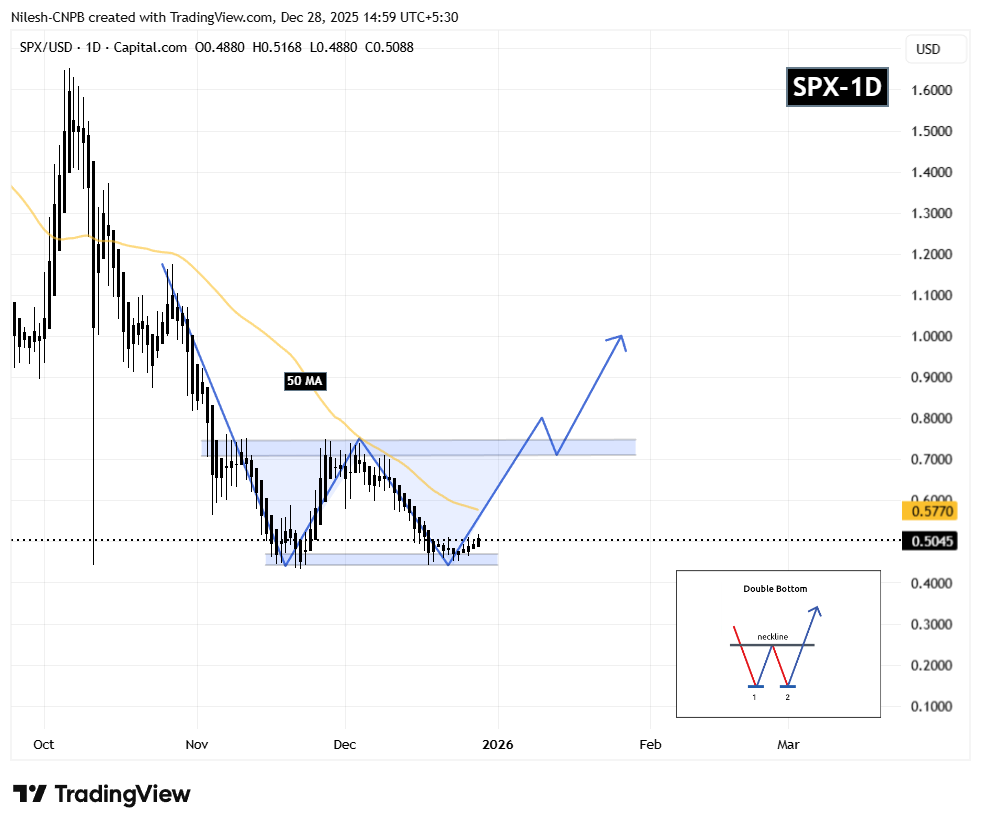
SPX6900 (SPX) Daily Chart/Coinsprobe (Source: Tradingview)
This repeated defense of the same support level is a critical technical signal. It suggests that selling pressure is weakening while buyers are gradually absorbing supply — a behavior typically seen during accumulation phases before trend reversals.
What’s Next for SPX?
For the bullish structure to strengthen, SPX must reclaim the 50-day moving average, currently positioned near $0.5770. A sustained move above this level would mark an important shift in short-term momentum and increase the probability of a continued recovery toward the neckline resistance at $0.7389.
A decisive breakout above the neckline — ideally followed by a successful retest — would confirm the full activation of the double bottom pattern. In that scenario, the technical projection points toward a potential upside target near $1.02, representing a significant expansion from current price levels.
Until then, the $0.45 support zone remains the most important level to watch. As long as SPX continues to hold above this area, the broader bullish setup stays intact and allows room for further upside attempts.
Overall, SPX’s structure appears constructive. The presence of a double bottom, repeated demand at identical lows, and proximity to the 50-day moving average suggest that this could be a pivotal moment as the token attempts to transition from accumulation into a new expansion phase.
Disclaimer: The views and analysis presented in this article are for informational purposes only and reflect the author’s perspective, not financial advice. Technical patterns and indicators discussed are subject to market volatility and may or may not yield the anticipated results. Investors are advised to exercise caution, conduct independent research, and make decisions aligned with their individual risk tolerance.
About Author: Nilesh Hembade is the Founder and Lead Author of Coinsprobe, with over 5 years of experience in the cryptocurrency and blockchain industry. Since launching Coinsprobe in 2023, he has been providing daily, research-driven insights through in-depth market analysis, on-chain data, and technical research.

Disclaimer: The information on this page may come from third parties and does not represent the views or opinions of Gate. The content displayed on this page is for reference only and does not constitute any financial, investment, or legal advice. Gate does not guarantee the accuracy or completeness of the information and shall not be liable for any losses arising from the use of this information. Virtual asset investments carry high risks and are subject to significant price volatility. You may lose all of your invested principal. Please fully understand the relevant risks and make prudent decisions based on your own financial situation and risk tolerance. For details, please refer to
Disclaimer.
Related Articles
Shiba Inu Golden Cross Emerges Amid Weak Market Signals
Key Insights
Shiba Inu’s hourly golden cross signals short-term strength, yet weak trading volume and rising exchange inflows highlight limited conviction among market participants.
Exchange inflows surged sharply within hours, suggesting increased profit-taking activity and adding pressure o
CryptoFrontNews5m ago
This Oversold Signal Has Triggered 350%, 1,800%, and 2,700% Bitcoin Surges Before
Although it has performed relatively well since the war in the Middle East broke out nearly a month ago, and has dwarfed gold in terms of gains within this period, bitcoin is far from its best shape observed in October last year.
The cryptocurrency trades nearly 50% below its all-time high of
CryptoPotato9m ago
PEPE Signals Range-Bound Move as Momentum Weakens
PEPE's trading remains cautious with neutral RSI and weak MACD, indicating limited momentum and ongoing selling pressure. Oversold stochastic hints at possible short-term rebounds, but traders await confirmation before entering positions amid mixed signals.
CryptoNewsLand30m ago
Here’s why bitcoin’s drop below $68,000 raises the risk of a crash under $60,000
President Donald Trump's renewed aggressive posturing toward Iran has pushed bitcoin lower by roughly 2% over the past 24 hours to $67,000. While this price action is consistent with routine volatility, beneath the surface, market structure looks fragile.
This is mainly due to flows in the
CoinDesk32m ago
SHIB Price Rises on Golden Cross and Growing Market Activity
Key Insights
The Shiba Inu price rose about five percent as an hourly golden cross and higher volume signaled renewed trader participation and short-term momentum strength.
Exchange outflows and rising liquidity suggest accumulation behavior among holders while reinforcing price stability
CryptoNewsLand40m ago
Cardano Breakout Gains Momentum as Institutional Focus Shifts
Key Insights:
ADA breakout above key EMAs and Supertrend support signals renewed bullish momentum, supported by rising derivatives activity and increased market participation levels.
Institutional demand for privacy, compliance, and execution certainty drives interest in Midnight,
CryptoNewsLand45m ago
