Mit dem nahenden Ende September schwankt der Bitcoin-Preis um 109.000 USD, während sich die Marktstimmung leise auf die Erwartung von “Uptober” (bullischer Oktober) wendet.
Dieses saisonale Phänomen ist kein Zufall; historische Daten zeigen, dass der Oktober oft einer der stärksten Monate für Bitcoin im gesamten Jahr ist. Allerdings ist das Marktumfeld in diesem Jahr komplex und verworren – der September hat zwar den traditionellen “Fluch” nicht gezeigt, aber die Volatilität innerhalb des Monats hat zugenommen, ETF-Mittel fließen in großem Umfang ab und die Unsicherheit der makroökonomischen Politik wirft einen Schatten auf die Entwicklung im vierten Quartal. Dieser Artikel wird die potenzielle Entwicklung von Bitcoin im vierten Quartal aus vier Perspektiven analysieren: historische Muster, aktuelle Marktdynamik, das Spiel der bullischen und bärischen Faktoren sowie die Ausblicke auf zukünftige Wege.
Eins: “Uptober” in der Geschichte: Datenunterstützung und saisonale Logik
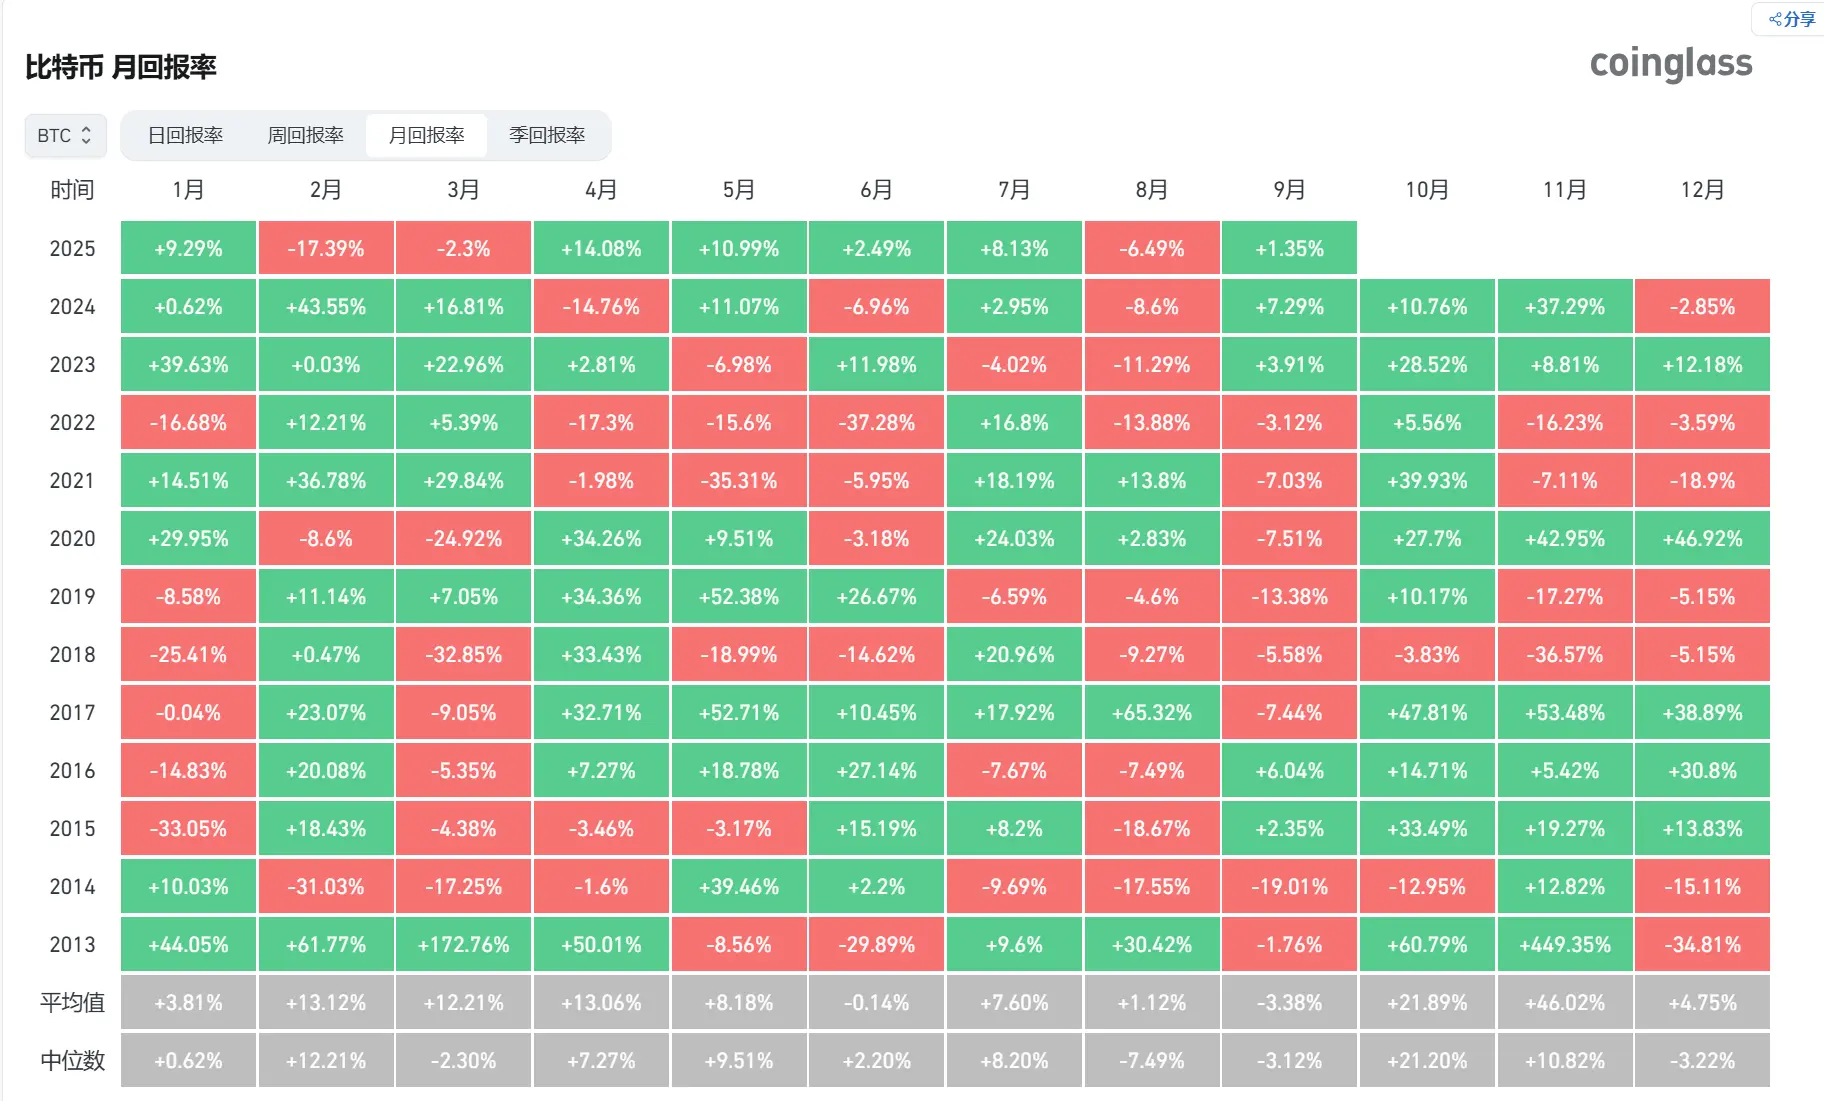
Seit 2013 zeigt Bitcoin im Oktober eine signifikante Regelmäßigkeit: In den letzten 12 Jahren gab es 10 Monate mit einem Aufstieg, mit einem durchschnittlichen Anstieg von 21,89%, wobei die Anstiege in den Bullenmärkten 2013 (+60,79%), 2017 (+47,81%) und 2021 (+39,93%) besonders hervorstechen.
Dieses Phänomen wird vom Markt als “Uptober” bezeichnet, und es gibt mehrere logische Unterstützungen dahinter.
Zunächst ist das vierte Quartal normalerweise ein Zeitraum, in dem institutionelle Gelder umgeschichtet werden. Die Investoren haben am Jahresende eine höhere Risikobereitschaft und neigen dazu, ihre Positionen in hochvolatilen Vermögenswerten zu erhöhen.
Zweitens bilden die Halbierungszyklen von Bitcoin häufig eine Resonanz mit dem Monat Oktober – zum Beispiel starteten die Bullenmärkte 2017 und 2021 jeweils im Oktober, und die Auswirkungen der Angebotsverknappung nach der Halbierung im Jahr 2024 könnten ebenfalls im vierten Quartal deutlich werden.
Darüber hinaus neigt das makroökonomische Liquiditätsumfeld im Oktober oft zur Lockerung: Die Federal Reserve hat in den letzten Jahren mehrfach im September-Oktober eine dovish Haltung eingenommen, und nach der Zinssenkung im September 2024 stiegen die Markterwartungen für eine weitere Zinssenkung im Oktober auf 91,9 %, was riskanten Anlagen Auftrieb gibt.
Jedoch ist die Geschichte kein absolutes Muster. Im Oktober 2014 und 2018 wurden Rückgänge von -12,95 % bzw. -3,83 % verzeichnet, was darauf hindeutet, dass “Uptober” nur in Wechselwirkung mit dem makroökonomischen Kontext wirksam sein kann.
Der September 2025 endete mit einem leichten Aufstieg von 1 %. Obwohl es keinen starken Rückgang gab, wurde auch nicht genügend Dynamik aufgebaut, was bedeutet, dass die Richtung im Oktober mehr von den aktuellen Fundamentaldaten als von rein saisonalen Mustern abhängt.
Zwei, aktueller Marktstatus: Das Erbe der Septembervolatilität und die Divergenz der finanziellen Situation
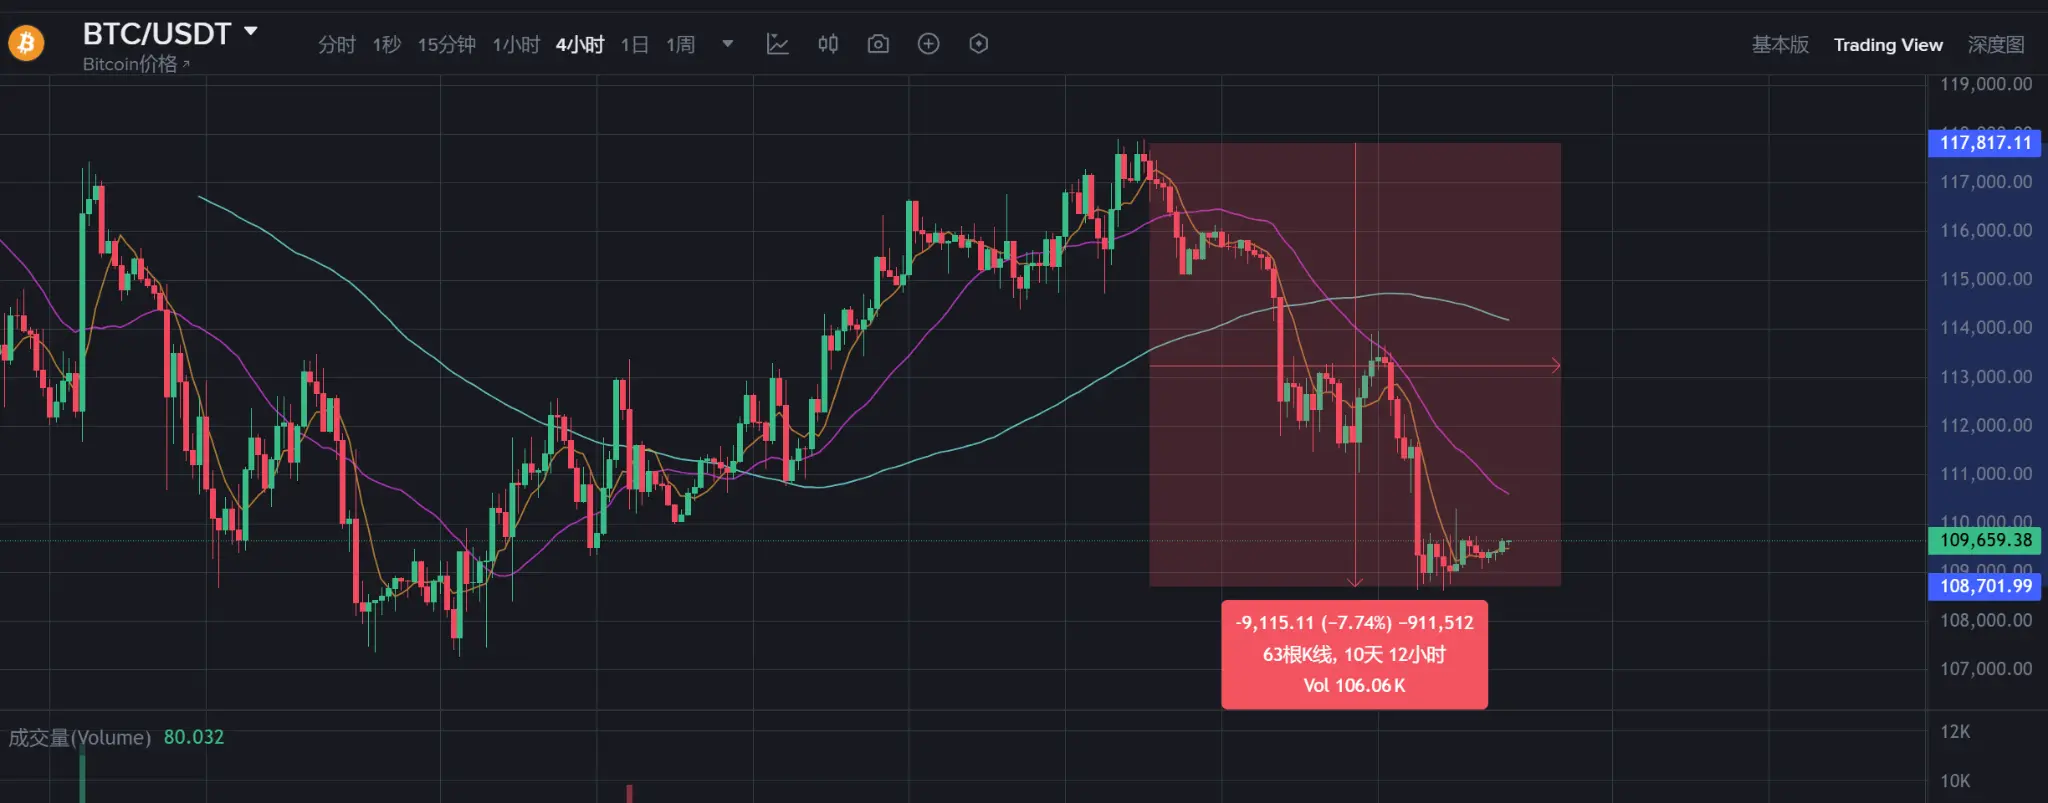
In den letzten zwei Wochen des Septembers fiel Bitcoin von 117.000 USD auf etwa 108.000 USD, was einem Rückgang von fast 8 % entspricht. Während dieser Zeit überstieg der Betrag der Liquidationen im gesamten Netzwerk 3 Milliarden USD, und die Long-Leverage-Positionen wurden massiv bereinigt.
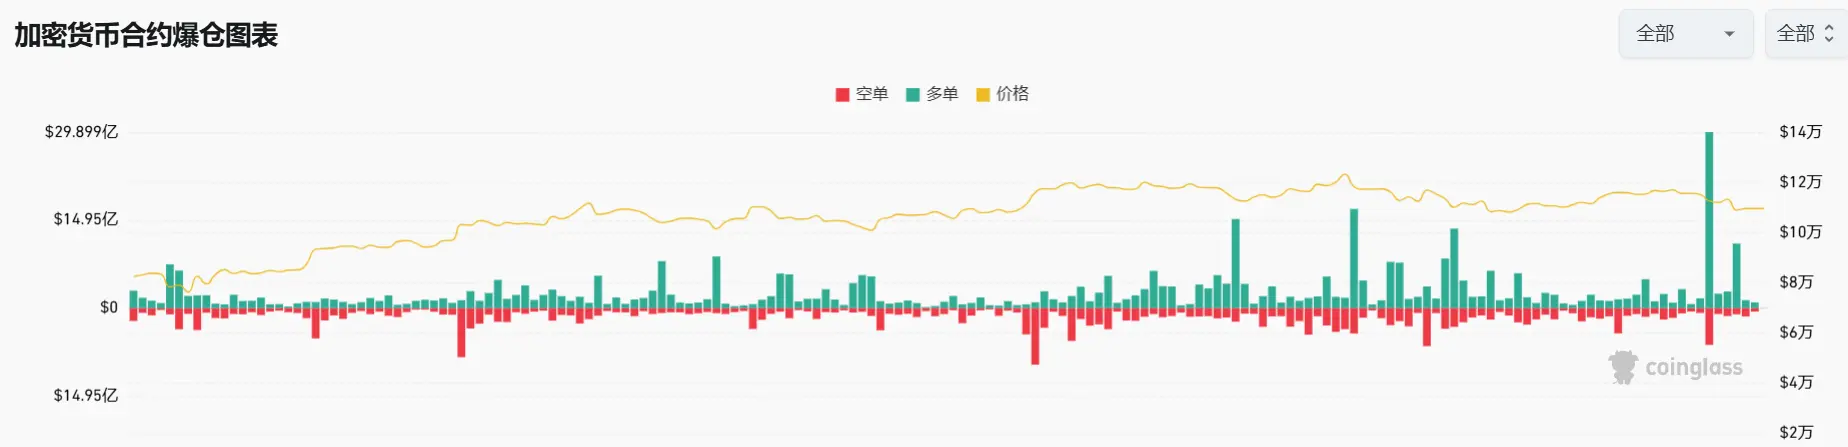
Diese Anpassung wird von einigen Analysten als “gesunde Korrektur” angesehen, da sie übermäßige Hebelwirkung beseitigt und die Grundlage für eine spätere Erholung gelegt hat. Die Signale auf der Finanzseite sind jedoch widersprüchlich:
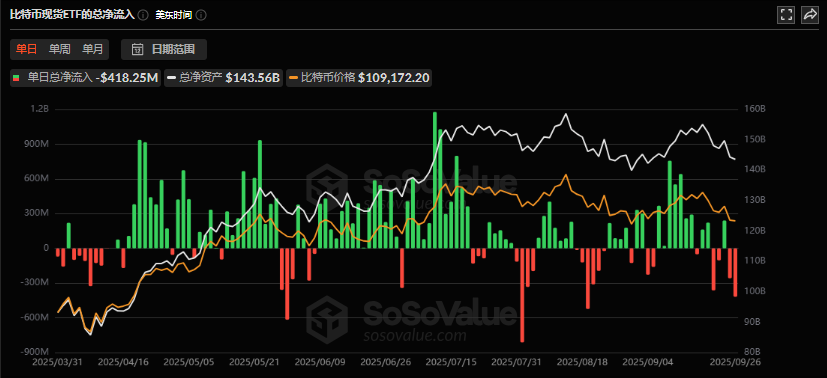
- ETF-Abfluss verschärft sich: Bitcoin Spot-ETFs verzeichnen seit mehreren Tagen Nettomittelabflüsse, die wöchentliche Summe erreicht 9,025 Millionen Dollar, BlackRock's IBIT und Fidelity's FBTC haben beide erhebliche Rücknahmen erlebt.
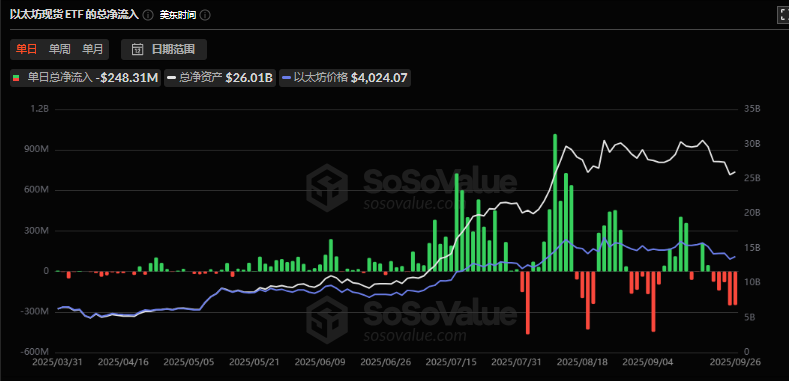
- Ethereum ETF ebenfalls schwach, wöchentlicher Abfluss von fast 800 Millionen USD, der schlechteste Rekord seit der Einführung. Die vorübergehende Abkühlung der institutionellen Nachfrage spiegelt die vorsichtige Haltung des Marktes gegenüber hochbewerteten Vermögenswerten wider.
- On-Chain-Daten zeigen Resilienz: Trotz des Preisdrucks haben Bitcoin-Langzeitbesitzer (HODLer) keine panikartigen Verkäufe gezeigt. Der Netto-realisierten Gewinn- und Verlustwert (NRPL) bleibt positiv, und der Kaufdruck in der Nähe der wichtigen Unterstützung bei 109.500 Dollar ist aktiv, was darauf hindeutet, dass das Vertrauen der Kerninvestoren in die langfristige Logik unverändert bleibt.
Diese Differenzierung offenbart den zentralen Widerspruch des Marktes: Die kurzfristigen Kapitalflüsse sind von makroökonomischer Unsicherheit (wie den unterschiedlichen Politiken der Federal Reserve und den Störungen durch die US-Wahlen) betroffen, während die Erzählung von der Knappheit von Bitcoin (Institutionen erhöhen ihre Bestände, Halbierungsversorgung schrumpft) weiterhin die langfristige Unterstützung darstellt.
Drittens, die Treiber des vierten Quartals: Das Wettkampfspiel zwischen Bullen und Bären.
1. Bullische Katalysatoren
- Makro-Liquiditätswende: Wenn die Federal Reserve am 29. Oktober auf der FOMC-Sitzung wie erwartet die Zinsen senkt, wird dies den Dollar schwächen. Historische Daten zeigen, dass die negative Korrelation zwischen Bitcoin und dem Dollar-Index -0,25 erreicht hat (Zwei-Jahres-Tiefpunkt). Während des Zinssenkungszyklus fließt Kapital leichter in den Kryptomarkt.
- Institutionelles Verhalten vertieft: Bis August 2025 halten über 290 Unternehmen Bitcoin im Wert von 163 Milliarden US-Dollar, wobei das Wachstum der Unternehmensnachfrage etwa 4,3-mal so hoch ist wie die Bitcoin-Produktion. Darüber hinaus ist ein Upgrade-Plan für Ethereum-Gabelungen für April 2026 vorgesehen; wenn das technische Upgrade erfolgreich ist, könnte dies das Interesse des Marktes an Plattformen für intelligente Verträge neu entfachen.
- Technische Schlüsselpositionen verteidigen: Bitcoin könnte, wenn es die Unterstützung bei 109.500 Dollar hält und den Widerstand bei 117.700 Dollar durchbricht, eine Trendwende auslösen. Technische Analysten glauben, dass der aktuelle Trend der Volatilität vor dem Start des Bullenmarktes 2017 sehr ähnlich ist.
2. Risiken und Druckfaktoren
- Regulatorische Unsicherheit: Die verstärkte Compliance-Prüfung von Krypto-Börsen durch die US-SEC sowie die Untersuchung des Modells der digitalen Vermögensverwaltung (DAT) könnten das Tempo des institutionellen Einstiegs dämpfen.
- Marktstimmung schwach: Der negative Rückkopplungseffekt von Geldabflüssen aus ETFs könnte den Verkaufsdruck verstärken, insbesondere wenn der Preis unter wichtige Unterstützungsniveaus fällt, könnte panikartiger Verkauf dazu führen, dass das Tief von 98.000 Dollar getestet wird.
- Potenzielle Auswirkungen von Black-Swan-Ereignissen: Kürzlich wurden Projekte wie UXLINK und GriffinAI von Hackerangriffen betroffen, was zu lokalem Panik führte. Falls Sicherheitsvorfälle sich ausbreiten, könnte dies das gesamte Vertrauen untergraben.
Vier, Zukunftsprognose: Marktentwicklung unter drei Szenarien
Basierend auf den aktuellen Variablen könnten im vierten Quartal folgende drei Szenarien auftreten:
Optimistisches Szenario (Wahrscheinlichkeit 30%): Die Federal Reserve sendet klare dovish Signale, Bitcoin erholt sich schnell auf 115.000 Dollar und herausfordert den historischen Höchststand. Institutionelles Kapital fließt zurück in ETFs, kombiniert mit der sich verstärkenden “Uptober”-Stimmung, die den Preis in Richtung des Ziels von 165.000 Dollar treibt.
Neutrales Szenario (Wahrscheinlichkeit 50%): Die bullischen und bärischen Faktoren ziehen sich gegenseitig, Bitcoin schwankt stark im Bereich von 100.000-120.000 Dollar. Der Markt wartet auf klare Signale wie die Ergebnisse der Zinssenkung in den USA, die Volatilität bleibt hoch, aber es fehlt an einem trendstarken Richtung.
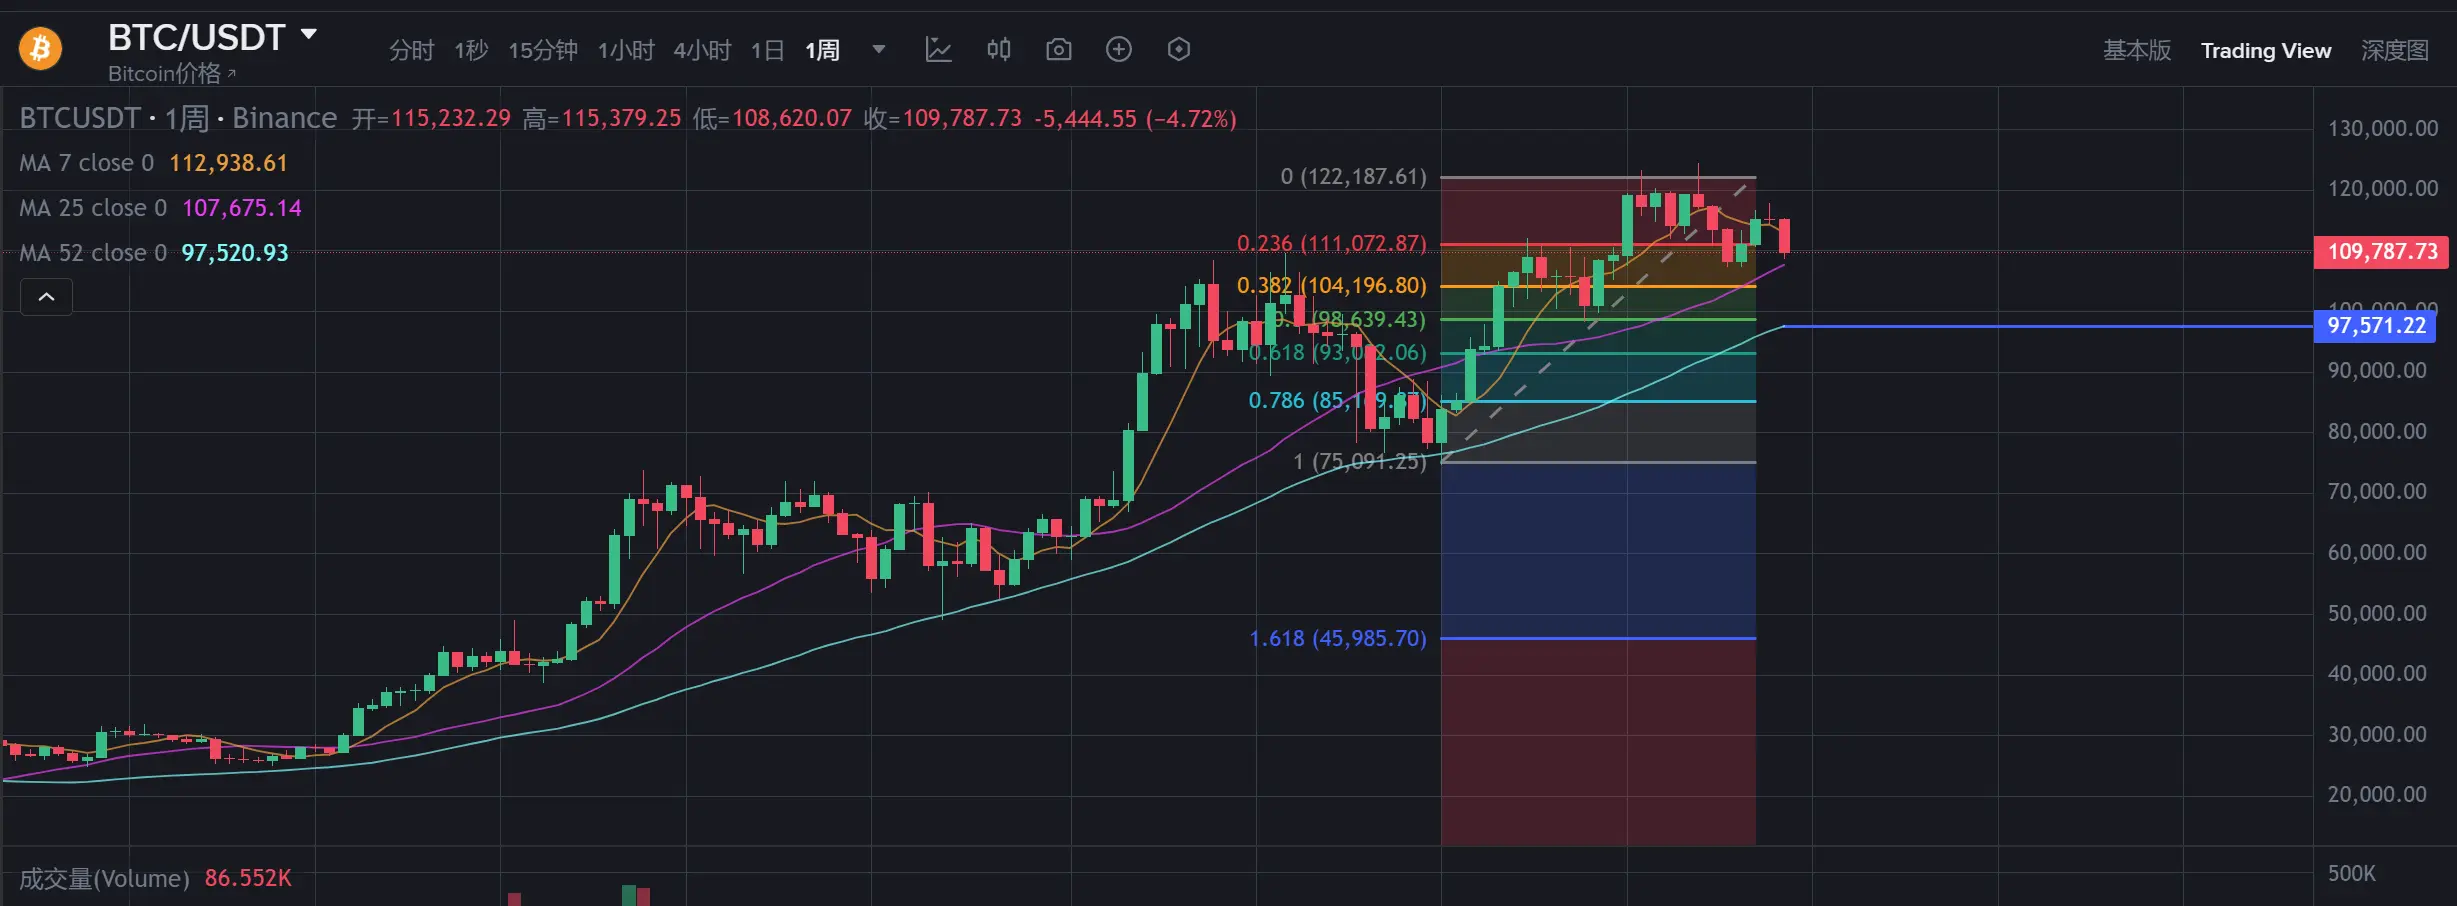
Vorsichtsszenario (Wahrscheinlichkeit 20%): Verschlechterung der makroökonomischen Daten, geopolitische Faktoren oder strengerer Regulierungsdruck lösen systematische Verkäufe aus, Bitcoin testet die Unterstützung bei 100.000 Dollar. Sollte dieser Punkt unterschritten werden, könnte ein weiterer Test von 98.000 Dollar (52-Wochen-Durchschnitt) erfolgen, doch langfristige Investoren könnten in diesem Bereich verstärkt aufkaufen.
Fazit: Ein Gleichgewicht zwischen saisonalen Mustern und aktuellen Fundamentaldaten suchen
“Uptober” ist kein automatisch einlösbarer Kalenderzauber, sondern eine Kombination aus historischen Wahrscheinlichkeiten und Marktpsychologie. Im vierten Quartal 2025 sieht sich Bitcoin sowohl kurzfristigem Druck durch institutionelle Kapitalabflüsse gegenüber als auch langfristiger Unterstützung durch den Zinszyklus und das Narrativ der Knappheit. Für Investoren ist es entscheidend, saisonale Muster rational zu betrachten und die Politik der Federal Reserve sowie die Veränderungen der ETF-Kapitalströme genau zu beobachten, um durch die Volatilität Chancen zu nutzen.
Disclaimer: The information on this page may come from third parties and does not represent the views or opinions of Gate. The content displayed on this page is for reference only and does not constitute any financial, investment, or legal advice. Gate does not guarantee the accuracy or completeness of the information and shall not be liable for any losses arising from the use of this information. Virtual asset investments carry high risks and are subject to significant price volatility. You may lose all of your invested principal. Please fully understand the relevant risks and make prudent decisions based on your own financial situation and risk tolerance. For details, please refer to
Disclaimer.
Verwandte Artikel
Bitcoin durchbricht 70.000 USDT, Tagesanstieg 1,68%
Gate News-Meldung: 7. April, laut Marktdaten einer Börse, hat Bitcoin die Marke von 70.000 USDT durchbrochen. Derzeit notiert er bei 70.004,04 USDT, die Tagesveränderung beträgt 1,68%.
GateNews46M her
BTC steigt in 15 Minuten um 0,98 %: Überweisung riesiger Wale nimmt stark zu, verstärkt durch gleichzeitigen Bedarf an Absicherung vor geopolitischen Risiken
2026-04-07 21:00 bis 21:15 (UTC) zeigten der BTC-Preis eine deutliche Kursbewegung. Die Rendite der Kerzen (K-Linien) lag bei +0.98%, die Preisspanne betrug 69309.9-70214.9 USDT, die Spanne (Amplitude) lag bei 1.31%. Kurzfristige Marktvolatilität nahm zu, das Interesse stieg, was gleichzeitig zu einem Anstieg des Handelsvolumens und der Anzahl aktiver Entitäten führte.
Die wichtigsten Treiber dieser Kursbewegung waren das Handelsverhalten von Walen. On-Chain-Daten zeigen, dass die von Wal-Entitäten mit mehr als 1,000 BTC an Börsen überwiesene Menge im Umfeld des Ereignisfensters stark anstieg. In den vergangenen 24 Stunden erreichte das Wal-Zuflussvolumen 10,5
GateNews50M her
BTC durchbricht 70000 USDT
Gate News Bot-Nachricht, Gate-Kursanzeige: BTC durchbricht 70000 USDT, aktueller Preis 70004 USDT.
CryptoRadar56M her
Bitcoin steigt über 69.000 US-Dollar, da Risikomärkte ihre großen frühen Verluste umkehren – in der Hoffnung auf einen Iran-Deal
Risikomärkte, einschließlich Bitcoin, erholten sich und legten zu, nachdem Berichte bekannt wurden, dass der Iran positiv auf Pakistans Bitte um einen Waffenstillstand reagiert hat. Dies folgte auf einen turbulenten Tag, der durch die alarmierenden Äußerungen von Präsident Trump über den Iran ausgelöst wurde und erhebliche Kritik nach sich zog.
CoinDesk1Std her
Bitcoin hält die $67K-Unterstützung, da Daten eine Preisabweichung zur Sentimentdynamik offenbaren
Bitcoin (BTC) zeigt weiterhin eine starke Unterstützung bei 67.000 $, obwohl sich eine zunehmende Spaltung zwischen der Preisstabilität von BTC und der bärisch gestimmten Haltung unter den Anlegern ergibt und die Kryptowährung in einem Gleichgewichtszustand belässt.
Die Widerstandsfähigkeit von BTC, Einbrüche unter 60.000 $ zu vermeiden, wurde durch starke institutionelle Investoren getrieben
Cointelegraph1Std her
