2025 WET Price Prediction: Expert Analysis and Market Forecast for the Next Bull Run


Introduction: WET's Market Position and Investment Value
HumidiFi (WET) serves as the largest decentralized exchange on Solana by trading volume, processing over $1 billion in daily volume—approximately 35% of all spot DEX activity on the chain. As of December 2025, WET has achieved a market capitalization of $208.63 million with a circulating supply of 230 million tokens, trading at approximately $0.20863 per token. Distinguished by its proprietary automated market maker (prop AMM) technology that combines on-chain execution with institutional-grade market-making logic, WET delivers tighter spreads, deeper liquidity, and superior execution compared to competing platforms.
This article will comprehensively analyze WET's price trajectory through 2030, integrating historical price patterns, market supply-demand dynamics, ecosystem development, and macroeconomic factors to provide investors with professional price forecasts and actionable investment strategies.
HumidiFi (WET) Market Analysis Report
I. WET Price History Review and Current Market Status
WET Historical Price Evolution
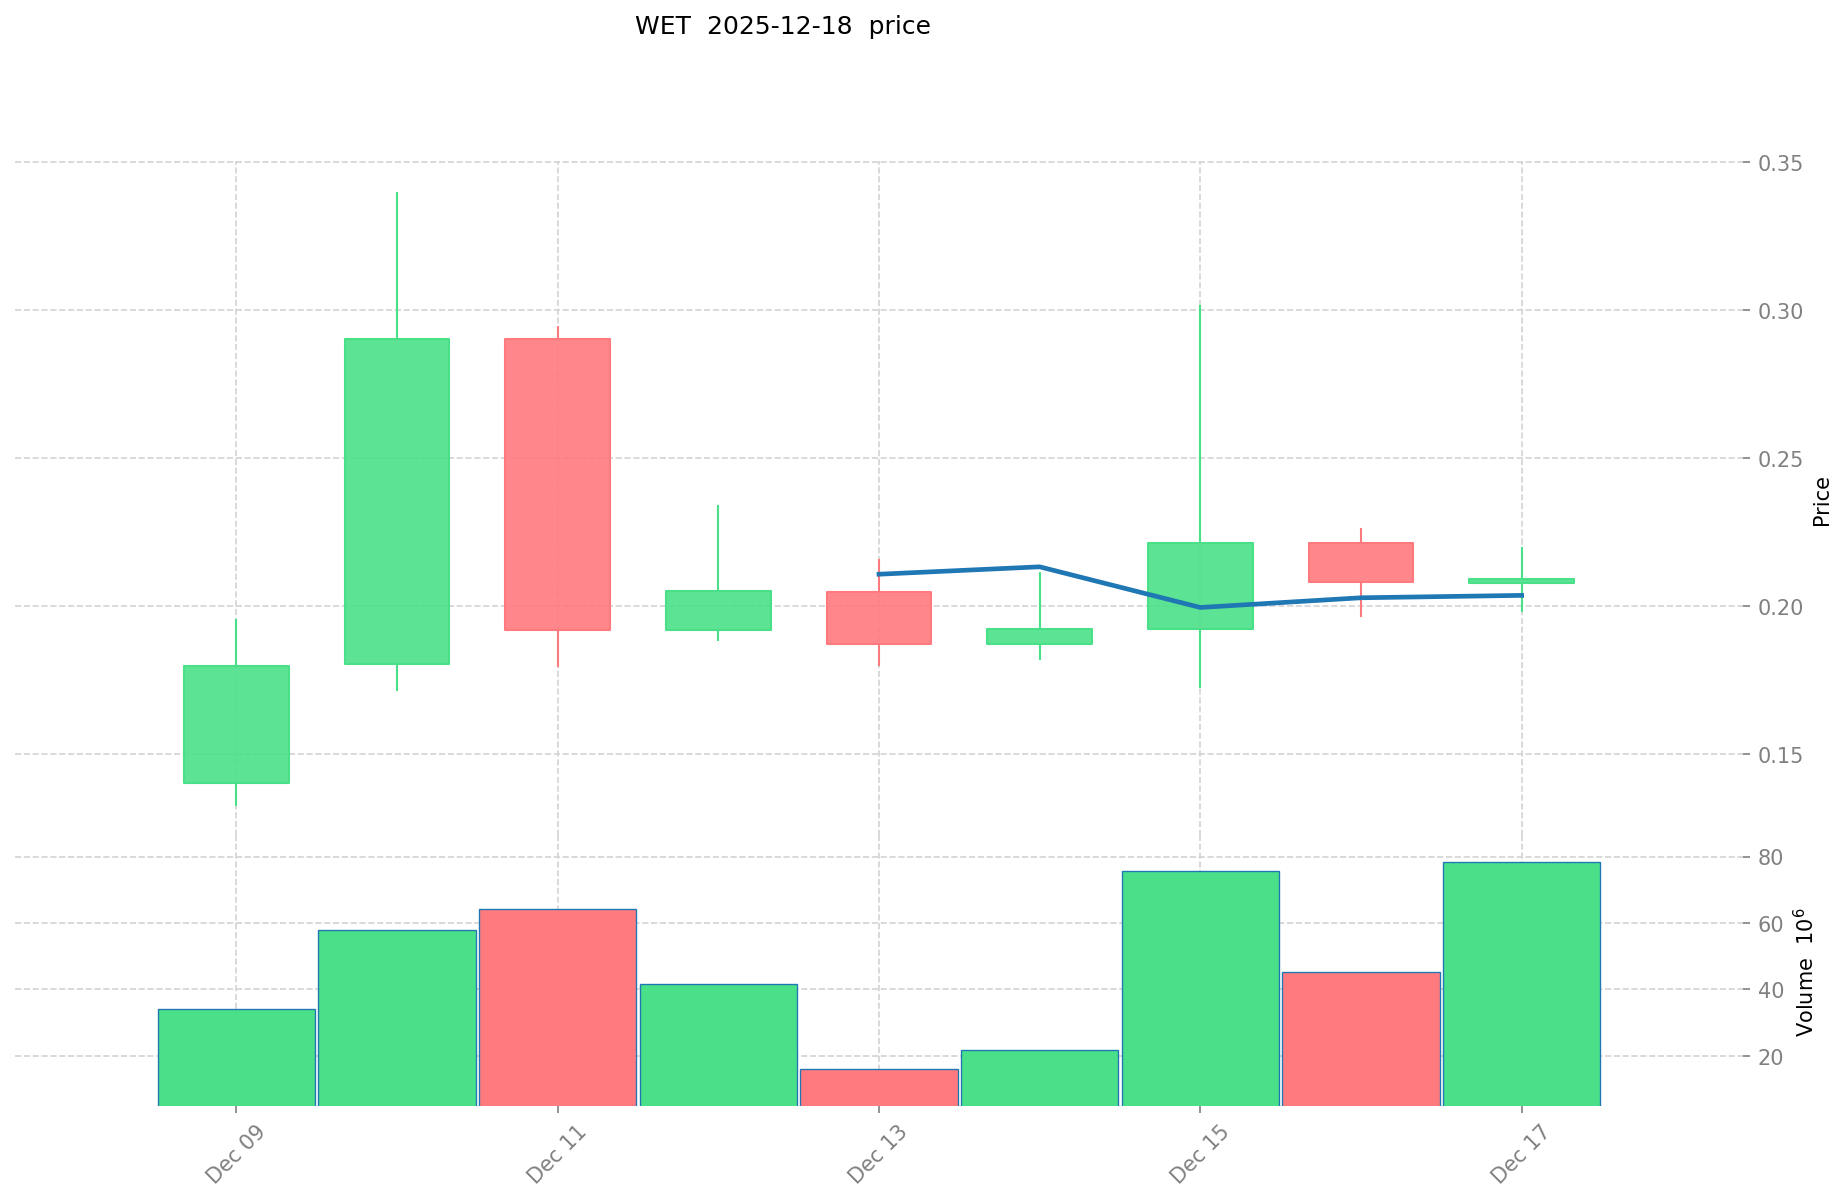
Based on available data, HumidiFi's WET token demonstrates significant volatility within a short timeframe:
- December 9, 2025: All-time low of $0.13249 established, marking the bottom of the initial price discovery phase
- December 10, 2025: All-time high of $0.34 reached, representing a 156.4% surge from the low point
- December 18, 2025: Price trading at $0.20863, down 38.6% from the recent peak
The 30-day and 1-year metrics show an 86.24% gain, indicating strong recovery momentum from the token's launch period despite recent short-term pullbacks.
WET Current Market Performance
Price Metrics:
- Current Price: $0.20863
- 24-Hour Range: $0.19976 - $0.21766
- All-Time High (ATH): $0.34 (December 10, 2025)
- All-Time Low (ATL): $0.13249 (December 9, 2025)
Market Capitalization:
- Market Cap (Circulating): $47,984,900
- Fully Diluted Valuation (FDV): $208,630,000
- Market Cap to FDV Ratio: 23%
- Trading Volume (24H): $5,150,565.94
Token Distribution:
- Circulating Supply: 230,000,000 WET
- Total Supply: 1,000,000,000 WET
- Circulation Ratio: 23.0%
- Token Holders: 6,173
Short-Term Price Performance:
- 1-Hour Change: -2.22%
- 24-Hour Change: +0.56%
- 7-Day Change: -1.98%
- 30-Day Change: +86.24%
WET maintains a market ranking of #512 with a market dominance of 0.0066%. The token is currently listed on 24 exchanges, reflecting growing accessibility and liquidity infrastructure. Trading activity remains relatively concentrated, suggesting the market is in early discovery phases following the December token launch.
Click to view current WET Market Price
WET Market Sentiment Indicator
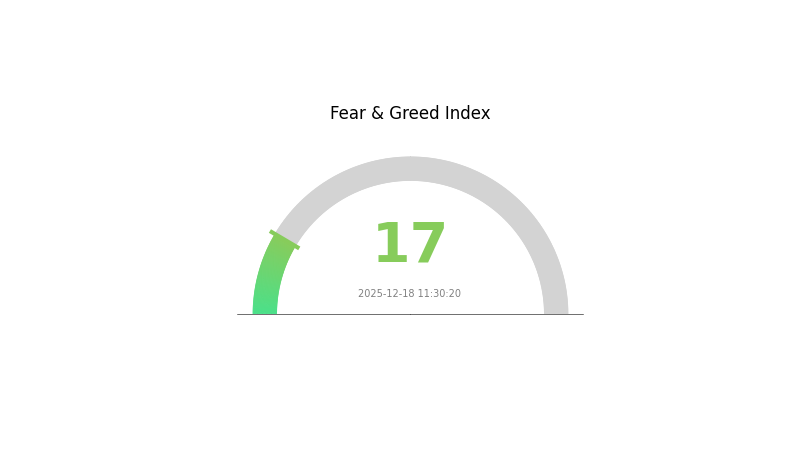
2025-12-18 Fear and Greed Index: 17 (Extreme Fear)
Click to view current Fear & Greed Index
The cryptocurrency market is currently experiencing extreme fear, with the Fear and Greed Index at 17. This indicates heightened market pessimism and significant risk aversion among investors. During periods of extreme fear, asset prices often experience substantial corrections, creating potential buying opportunities for long-term investors. However, caution is advised as market volatility remains elevated. Monitor key support levels and consider dollar-cost averaging strategies when entering positions. On Gate.com, you can track real-time market sentiment data to make more informed trading decisions.
WET Holdings Distribution
Address holdings distribution refers to the concentration pattern of token ownership across blockchain addresses, serving as a critical metric for assessing token decentralization, market structure, and potential systemic risks. By analyzing the top holders and their respective share percentages, we can evaluate the degree of wealth concentration and the resilience of the token's underlying ecosystem.
WET currently exhibits significant concentration risk, with the top three addresses commanding 77.00% of total supply. The leading address (BtZ8jP...sjVH3Q) alone holds 32.00%, while the second and third largest holders control 25.00% and 20.00% respectively. This distribution pattern suggests that decision-making power and price influence are heavily concentrated among a small group of entities. The fourth and fifth largest addresses contribute an additional 11.49% combined, leaving only 11.51% distributed among remaining holders. Such extreme concentration in the top tier indicates a highly centralized token structure that deviates significantly from the decentralization principles typically associated with blockchain assets.
The current holdings distribution presents notable implications for market dynamics and ecosystem stability. The concentration of over three-quarters of the supply within three addresses creates substantial liquidation risk and potential for coordinated market manipulation. Large holders possess the capacity to execute significant price movements through relatively modest trading volumes, thereby undermining price discovery mechanisms. Furthermore, the narrow distribution base limits organic liquidity generation and increases vulnerability to sudden market shocks triggered by major holder actions. This structural characteristic reflects a token distribution model more aligned with traditional venture capital concentration rather than a truly decentralized network, warranting careful monitoring of holder activities and market sentiment.
Visit to check the current WET holdings distribution
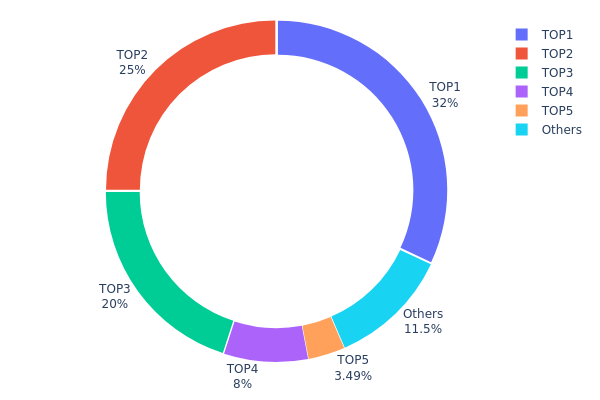
| Top | Address | Holding Qty | Holding (%) |
|---|---|---|---|
| 1 | BtZ8jP...sjVH3Q | 320000.00K | 32.00% |
| 2 | AsEVCx...yZZ4uy | 250000.00K | 25.00% |
| 3 | 7w7tTB...kXpXyz | 200000.00K | 20.00% |
| 4 | A8t1fd...Kzxznj | 80000.00K | 8.00% |
| 5 | 7zRoQf...WASTJL | 34901.50K | 3.49% |
| - | Others | 115098.44K | 11.51% |
II. Core Factors Affecting WET's Future Price
Macroeconomic Environment
-
Monetary Policy Impact: The current market is primarily influenced by Federal Reserve monetary policy, with interest rate cut expectations playing a major role. Changes in the Fed's policy stance will significantly affect investor sentiment and market direction.
-
Global Economic Indicators: Market demand cycles are guided by global GDP growth rates. Monitoring macroeconomic data and overall economic health is essential for understanding potential price movements in WET.
Market Sentiment and Investor Behavior
-
Investor Confidence: WET's price is heavily influenced by market demand, investor sentiment, and overall market emotions. When investor confidence declines, there is a higher likelihood of price distortion and volatility. The strength of buying and selling forces in the market directly reflects trader and investor sentiment.
-
ETF Effects and Market Trends: Spot ETF approvals and subsequent trading availability can drive significant shifts in investor emotion. These institutional entry points often create important catalysts for price movement and market participation expansion.
III. 2025-2030 WET Price Forecast
2025 Outlook
- Conservative Forecast: $0.19405 - $0.20866
- Base Case Forecast: $0.20866
- Optimistic Forecast: $0.22535 (requiring sustained market momentum and positive ecosystem developments)
2026-2028 Medium-term Outlook
- Market Phase Expectation: Gradual accumulation phase with incremental price appreciation driven by expanding adoption and protocol maturation.
- Price Range Projections:
- 2026: $0.13237 - $0.23437 (potential volatility, +4% upside)
- 2027: $0.21215 - $0.25503 (+8% upside)
- 2028: $0.12979 - $0.27401 (+15% upside)
- Key Catalysts: Protocol upgrades, increased institutional participation, improved market liquidity on platforms like Gate.com, and expanding DeFi integration.
2029-2030 Long-term Outlook
- Base Case Scenario: $0.25718 - $0.31633 (assuming steady ecosystem development and moderate market growth)
- Optimistic Scenario: $0.34797 - $0.37548 (strong network effects, significant institutional adoption, and sustained bull market conditions)
- Transformational Scenario: Above $0.37548 (extreme bullish conditions including mainstream adoption, major partnerships, and positive macroeconomic environment)
- 2030 Peak Target: WET at $0.37548 (+51% cumulative growth from 2025 baseline)
| 年份 | 预测最高价 | 预测平均价格 | 预测最低价 | 涨跌幅 |
|---|---|---|---|---|
| 2025 | 0.22535 | 0.20866 | 0.19405 | 0 |
| 2026 | 0.23437 | 0.21701 | 0.13237 | 4 |
| 2027 | 0.25503 | 0.22569 | 0.21215 | 8 |
| 2028 | 0.27401 | 0.24036 | 0.12979 | 15 |
| 2029 | 0.37548 | 0.25718 | 0.21089 | 23 |
| 2030 | 0.34797 | 0.31633 | 0.20878 | 51 |
HumidiFi (WET) Professional Investment Strategy and Risk Management Report
IV. WET Professional Investment Strategy and Risk Management
WET Investment Methodology
(1) Long-term Holding Strategy
- Target Investors: Solana ecosystem believers and DEX infrastructure investors with medium-to-long term horizons
- Operation Recommendations:
- Accumulate WET tokens during market pullbacks, particularly when daily trading volume on HumidiFi remains above $500 million
- Set a multi-year holding period to benefit from potential growth in Solana's DEX ecosystem and HumidiFi's market dominance expansion
- Dollar-cost averaging (DCA) approach to reduce timing risk, especially given the recent 86.24% 30-day performance volatility
(2) Active Trading Strategy
- Technical Analysis Tools:
- Resistance and Support Levels: Monitor the historical high of $0.34 (all-time high on December 10, 2025) as primary resistance and $0.19976 (24-hour low) as immediate support
- Volume Analysis: Track the 24-hour trading volume of $5.15M against historical patterns; increased volume near support levels may indicate accumulation opportunities
- Wave Trading Key Points:
- Entry Strategy: Consider positions near the 24-hour low of $0.19976 with tight stop-losses below $0.18
- Exit Strategy: Take partial profits at resistance levels, particularly near the $0.30 zone or upon volume spikes exceeding $10M in 24-hour trading
WET Risk Management Framework
(1) Asset Allocation Principles
- Conservative Investors: 1-3% of total crypto portfolio allocation
- Active Investors: 3-7% of total crypto portfolio allocation
- Professional Investors: 5-10% of total crypto portfolio allocation, with hedging strategies
(2) Risk Hedging Solutions
- Position Sizing: Limit individual position size to prevent catastrophic losses; use trailing stop-losses set at 15-20% below entry points
- Portfolio Diversification: Avoid overconcentration in single DEX tokens; balance WET exposure with positions in other Solana infrastructure tokens and broader market exposure
(3) Secure Storage Solution
- Hardware wallet Method: Transfer significant WET holdings to hardware wallets that support Solana's SPL token standard for enhanced security
- Self-Custody Best Practices: Maintain private keys in secure, offline storage; never share seed phrases or private keys with third parties
- Security Precautions: Enable multi-signature wallets for holdings exceeding $50,000 equivalent; regularly audit wallet transactions and verify contract addresses before transactions
V. WET Potential Risks and Challenges
WET Market Risks
- Extreme Price Volatility: WET has experienced 86.24% gains over the past 30 days but has also shown -2.22% hourly fluctuations, indicating significant short-term price instability
- Liquidity Concentration: With only 23% of total supply in circulation (230M of 1B tokens), future token releases could dilute existing holders and trigger price pressure
- Competition Intensification: Other DEX platforms on Solana and alternative Layer-1 blockchains may introduce similar proprietary AMM models, potentially eroding HumidiFi's market share from its current 35% of spot DEX volume
WET Regulatory Risks
- Evolving Regulatory Landscape: Continued regulatory scrutiny of decentralized finance and DEX platforms globally could impose restrictions on trading pairs or operational requirements
- Jurisdictional Compliance: Different regulatory frameworks across countries may limit HumidiFi's global accessibility or require operational adjustments
- Securities Classification Risk: Regulatory bodies may classify governance or economic rights associated with WET as securities, triggering compliance obligations
WET Technology Risks
- Solana Network Stability: HumidiFi's operations are entirely dependent on Solana's blockchain stability; network congestion, outages, or technical failures would directly impact HumidiFi's performance
- Smart Contract Vulnerabilities: Potential undiscovered bugs or security flaws in HumidiFi's proprietary AMM smart contracts could result in fund losses or service disruptions
- Market-Making Logic Risks: The proprietary AMM model's complex algorithms may face unexpected market conditions that degrade execution quality or create arbitrage vulnerabilities
VI. Conclusion and Action Recommendations
WET Investment Value Assessment
HumidiFi (WET) represents a compelling infrastructure play within the Solana ecosystem, backed by its dominant market position (35% of spot DEX volume, $1B+ daily trading volume). The proprietary AMM model demonstrates superior execution and liquidity compared to traditional competitors. However, significant risks exist, including extreme price volatility (86.24% 30-day gains), low circulation ratio (23%), and technology dependence on Solana network stability. The current price of $0.20863 reflects recent gains but remains subject to distribution risk from 770M unlocked tokens.
WET Investment Recommendations
✅ Beginners: Start with small positions (1-2% of crypto portfolio) using dollar-cost averaging over 3-6 months. Focus on understanding HumidiFi's competitive advantages before increasing exposure. Use Gate.com's trading platform for convenient access and liquidity.
✅ Experienced Investors: Implement tactical trading strategies around identified support ($0.19976) and resistance ($0.30-0.34) levels. Combine 50% core long-term holdings with 50% active trading allocation. Monitor daily volume trends above $5M as confirmation signals.
✅ Institutional Investors: Conduct deep due diligence on token unlocking schedules and team intentions. Consider OTC purchases to minimize slippage. Implement multi-signature custody solutions for holdings exceeding $1M equivalent.
WET Trading Participation Methods
- Spot Trading: Buy and hold WET directly on Gate.com for direct exposure with minimal complexity
- Limit Orders: Set automated buy orders at $0.18-0.19 and sell orders at $0.28-0.32 to capture swing trading opportunities
- Market Analysis Integration: Monitor HumidiFi's daily trading volume, Solana network activity, and competitive DEX performance to time entries and exits strategically
Cryptocurrency investment carries extreme risk. This report does not constitute investment advice. Investors must make decisions based on their individual risk tolerance and should consult professional financial advisors. Never invest more capital than you can afford to lose completely.
FAQ
How much will cryptocurrency be worth in 2025?
WET's value in 2025 depends on market demand, adoption, and industry trends. While some cryptocurrencies have shown strong performance this year, prices remain highly volatile. Monitor WET's trading volume and market sentiment for informed decisions on its potential worth.
What is the secret coin price prediction for 2030?
By mid-July 2030, Secret coin is predicted to reach approximately €0.2396 under a neutral market scenario. This forecast is speculative and based on current market analysis trends.
What is the highest prediction for crypto?
Bitcoin is predicted to reach over $200,000, while Ethereum and Solana are expected to hit new all-time highs. These predictions are based on current market trends and expert analysis of the crypto market.
What will Wink be worth in 2030?
Based on current market trends and analysis, WinkHub (WINK) is projected to reach approximately $0.021 by 2030. However, specific long-term predictions beyond 2026 remain uncertain due to market volatility and evolving factors.
Share
Content
Introduction: WET's Market Position and Investment Value
I. WET Price History Review and Current Market Status
II. Core Factors Affecting WET's Future Price
2025 Outlook
2026-2028 Medium-term Outlook
2029-2030 Long-term Outlook
IV. WET Professional Investment Strategy and Risk Management
V. WET Potential Risks and Challenges
VI. Conclusion and Action Recommendations
FAQ
How to Buy Cryptocurrency


Trending Cryptocurrencies


2025 JUP Price Prediction: Analyzing Market Trends and Potential Growth Factors for Jupiter's Native Token

2025 DBR Price Prediction: Expert Analysis and Market Forecast for Digital Blockchain Reserve Token

2025 FIDA Price Prediction: Expert Analysis and Market Outlook for the Coming Year

Will Crypto Recover in 2025?

2025 DYDX Price Prediction: Evaluating Growth Potential and Market Factors for the Leading Derivatives Exchange Token

2025 1INCH Price Prediction: Analyzing Growth Potential and Market Trends for the DeFi Aggregator Token

Discover the Advantages and Features of a Leading Blockchain Platform

Exploring StarkNet: Mastering Ethereum Scaling with StarkEx

2025 VINE Price Prediction: Expert Analysis and Market Outlook for the Year Ahead

2025 LUCIC Price Prediction: Expert Analysis and Market Forecast for the Coming Year

2025 SLP Price Prediction: Expert Analysis and Market Forecast for Smooth Love Potion Token