
The Cardano price has been grinding lower for months now. Since late 2025, each bounce has topped out beneath the last one, and sellers have consistently stepped in before any real recovery could take shape. But there is now a growing argument that the worst may already be behind it.
Analyst Mr Brownstone pointed out on X that there is a legitimate chance the February 2026 low marked the end of a larger corrective phase.
His view is based on Elliott Wave structure, specifically the idea that a PRIMARY WAVE (2) may have completed at that low. It’s an optimistic take, but one that still requires confirmation.
What the Cardano Chart Is Showing
On the 4H chart, the ADA price dropped sharply into the February low around the $0.22 area. That level clearly stands out as a major pivot, as price reacted quickly and bounced from it. Since then, the fall has slowed down, and ADA has begun to establish a range rather than continuing to plummet lower.
The alternative wave count, shown in yellow, indicates that the overall correction may have ended at that stage. If that interpretation is correct, ADA would now be transitioning from a prolonged correction into the early stages of a new upward phase.
However, the analysis also makes it clear that confirmation is not immediate.In order for the overall bullish pattern to be confirmed, the Cardano price must reclaim $0.74. Until then, this is a developing pattern and not yet a reversal.
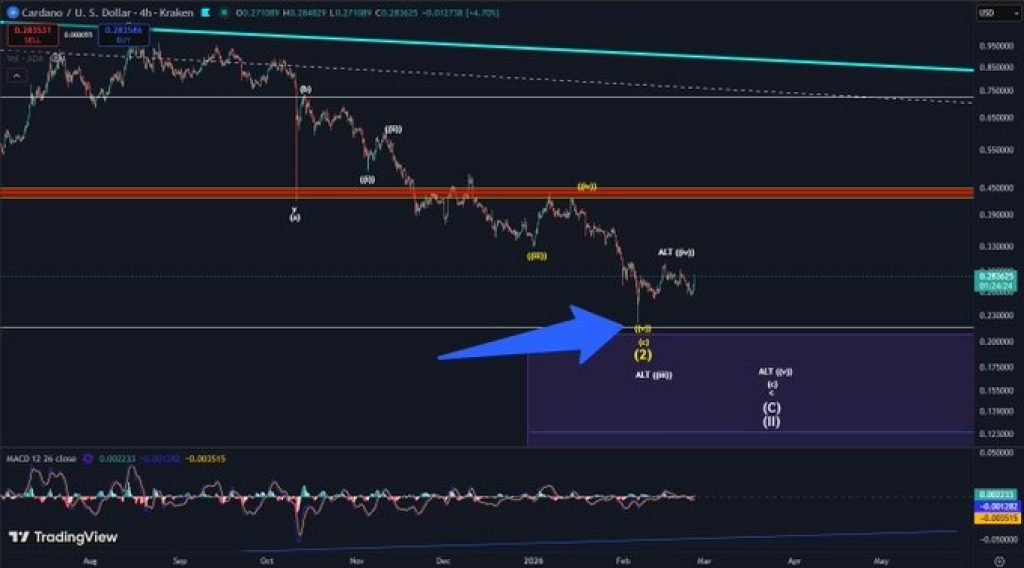
Source: X/MrBrownStone
Cardano Price Key Level Bulls Must Defend
The most important level on the chart right now sits near $0.222. That February low is the line separating optimism from another wave down.
However, if the ADA price declines from the current levels and creates a higher low above the $0.222 level, it would further reinforce the argument for the bottom already being in.
If ADA pulls back and forms a higher low, it would show that sellers are losing control and that buyers are stepping in sooner than they did during the previous drops.
_****TAO vs. Other AI Cryptos: Why Bittensor Is Different (And Why It Could Be the Bitcoin of AI)**
But if price slips under $0.222, that idea falls apart. At that point, the market would be signaling that the correction still has unfinished business. In that case, the market may need one more deeper flush before the correction truly ends.
According to the analysis, even that scenario could represent the final phase of the pullback, but it would delay any strong recovery narrative.
The Cardano price is no longer falling in a straight line. The panic phase has eased, and the chart looks more like it’s catching its breath than breaking down. Sellers aren’t pressing with the same force, and price is hovering instead of sliding.
The real test comes on the next dip. If buyers step in before $0.222 gives way, this stretch could end up being the floor. If that level cracks, the market likely isn’t done cleaning itself out.
Disclaimer: The information on this page may come from third parties and does not represent the views or opinions of Gate. The content displayed on this page is for reference only and does not constitute any financial, investment, or legal advice. Gate does not guarantee the accuracy or completeness of the information and shall not be liable for any losses arising from the use of this information. Virtual asset investments carry high risks and are subject to significant price volatility. You may lose all of your invested principal. Please fully understand the relevant risks and make prudent decisions based on your own financial situation and risk tolerance. For details, please refer to
Disclaimer.
Related Articles
Altcoin XRP Forms Elliott Wave on the Weekly Price Chart, Potential Bullish Divergence Ahead?
Altcoin XRP forms Elliott Wave on the weekly price chart.
A potential bullish divergence lies ahead for XRP price.
Can Ripple’s XRP go on to set a new ATH this year?
Several altcoins continue to show promising price pump indicators across their various price charts, allowing analysts t
CryptoNewsLand17m ago
BTC drops 0.52% in 15 minutes: Whale inflows to exchanges combined with insufficient liquidity amplify sell pressure
From 2026-04-17 10:15 to 2026-04-17 10:30 (UTC), the BTC price rapidly fell within the 75214.3 – 75725.9 USDT range. The cumulative return over 15 minutes was -0.52%, and the amplitude reached 0.68%. During this period, market sentiment shifted from cautious to bearish, volatility on the board increased, mainstream trading pairs saw an increase in主动 sell-side volume, buy-side acceptance became constrained, and overall trading activity declined significantly.
The primary driver behind this unusual move is that large holders (whales) concentrated their short-term inflows into exchanges. On-chain data shows that net inflows to addresses holding more than 1000 BTC per address changed from a steady state to a positive value, directly boosting exchange balances over the short term. Historical data indicates that whale inflows to exchanges are highly correlated with sell pressure in the medium to short term. In the same period, order book snapshots reflected a significant increase in the volume of主动 sell orders, and the成交价梯度 shifted downward, highlighting that weak market absorption capacity caused a short-term drop in price.
In addition, in the derivatives market, the long/short positioning structure tilted toward shorts. The number of主动 sell contracts exceeded that of buys in a short time, and rising pressure to close long positions further intensified the downtrend. Market liquidity overall was relatively weak; the number of active addresses over the past 10 minutes was only about 42k, and both fees and the mempool were near their lowest levels of the recent month. Against a backdrop of insufficient capital absorption, the marginal impact of large sell orders was amplified. On the macro front, the Federal Reserve’s monetary policy tightening and industry media repeatedly downgraded BTC’s near-term expectations led investors’ risk appetite to generally decline, creating a resonance at the level of market sentiment.
In the short term, it is still necessary to stay alert to liquidity risk and the price impact of one-way large transactions in specific trading pairs. Going forward, focus on key developments such as changes in whales’ on-chain holdings, exchange balances, and rebounds in activity metrics, as well as the potential impact of macro policy direction on risk assets. Relevant users should primarily guard against the risk of sharply amplified short-term price volatility and promptly track more market information.
GateNews2h ago
Popular Analyst Remains Aggressively Bullish on Crypto Prices, Predicts Parabolic Surges Soon
Popular analyst remains aggressively bullish on crypto prices.
The expert then predicts parabolic surges soon.
The move could spark dead coins into pumping heavily as well.
The crypto community continues to hold
CryptoNewsLand2h ago
RAVE, SIREN Rally Despite Manipulation Warnings
Rave DAO and Siren tokens surged to near all-time highs, facing volatility and liquidation risks. Concerns grew over potential market manipulation and supply concentration, particularly for RAVE. A new KuCoin listing boosted RAVE's visibility, despite inherent trading risks.
CryptoFrontier2h ago
ETH rises 0.65% in 15 minutes: ETF fund inflows and leverage long accumulation resonate to lift spot prices
Between 2026-04-17 09:15 and 2026-04-17 09:30 (UTC), ETH fluctuated within the 2351.53 to 2376.99 USDT range. The 15-minute return recorded +0.65%, with a swing of 1.08%. Within this range, buying pressure significantly strengthened, with trades dominated by medium-sized orders, which increased market attention and amplified short-term volatility.
The main drivers behind this anomaly are continued inflows of institutional capital into ETH spot ETFs, especially with cumulative net inflows over the past 4 days exceeding $212 million. On April 17 alone, the ETF added an additional $9.5 million in inflows, and spot buy orders expanded in sync within 15 minutes. Leveraged long positions in the derivatives market are the second-largest catalyst. From April 14 to 17, ETH futures open interest grew 26% week over week, indicating that capital via multiple paths is simultaneously betting on an upside move. The funding rate being neutral suggests the leveraged structure is temporarily healthy.
In addition, global macro market risk appetite has rebounded (geopolitical tensions easing, and the Federal Reserve keeping rates unchanged), driving a broad rebound across mainstream risk assets, and the crypto market has attracted liquidity accordingly. At the industry level, major financial institutions are advancing filings for ETFs and trust products. Mining companies have increased their ETH holdings and also maintained active staking activity, further reinforcing medium- to long-term market expectations. Multiple factors overlap and resonate, amplifying volatility. On-chain transfers remain generally stable, and there is no abnormal concentration of fund flows migrating between exchanges.
What needs attention is that although the current market is lifted by the resonance of institutional capital and leverage, the continuous growth of futures positions combined with the spot price failing to rise above the 2400 USDT area will bring the risk of forced liquidation. Meanwhile, if ETF subscription inflows slow down or macro liquidity reverses, ETH spot support could weaken. Please focus on tracking ETF net inflows, changes in futures open interest, the macro news backdrop, and nearby support and resistance levels, and stay alert to short-term volatility and potential abrupt adjustments. For more real-time market information, please keep watching.
GateNews3h ago
BTC up 0.58% in 15 minutes: exchange net outflows and ETF buy orders converge to lift the price
Between 2026-04-17 08:45 and 2026-04-17 09:00 (UTC), the BTC price surged in the short term. The candlestick return was +0.58%, with a price range of 75265.0 - 75862.3 USDT and a range of 0.79%. Market volatility increased and attention rose, with trading volume significantly higher than usual, reflecting a convergence between capital flow and technical signals.
The main driver behind this unusual move is the exchange’s net outflow of BTC in sync with ETF capital inflows. Data shows that within the past 24 hours, exchanges recorded a net outflow of 2,844.68 BTC
GateNews3h ago
