
Hedera (HBAR) has been busy behind the scenes. FedEx has joined the Hedera Council, showing that large companies are getting involved.
Hedera was also featured in a World Economic Forum session on responsible AI, placing it in wider global talks. However, Hashgraph picked up a DEVIES Award for its work on HashSphere.
Despite all that, the HBAR price is trading around $0.098, and the chart still shows a cautious structure.
- Here’s What The Hedera Chart Is Showing
- What the Indicators Are Showing
- Hedera Price Targets to Watch This Week
Here’s What The Hedera Chart Is Showing
On the 4H chart, HBAR has been in a steady downtrend for months. Price kept printing lower highs and slowly sliding from the $0.18–$0.20 area down toward the recent low near $0.072.
After touching that low, the HBAR price bounced and is now hovering just under the $0.10 mark. The chart looks more like a pause after a long drop than a real breakout.
Price is moving sideways between $0.095 and $0.10. That range is where buyers and sellers are fighting right now.
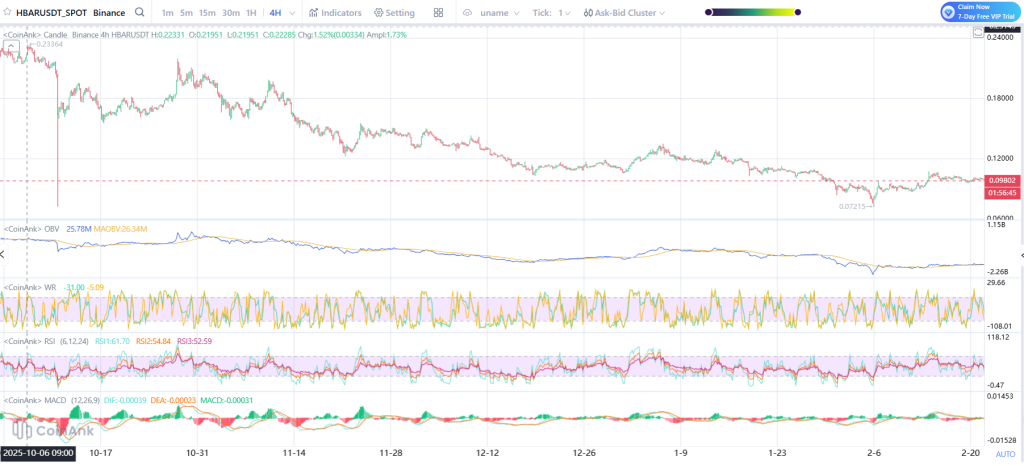
Source: Coinank
What the Indicators Are Showing
OBV has flattened after trending down for weeks. This implies that the selling pressure has eased, but the strong buying force has not yet fully come back.
The Williams %R indicator is currently close to the middle area, indicating that HBAR is not significantly oversold or overbought. The RSI is also close to the middle area, confirming the previous statement.
The MACD indicator is close to the zero level with small histogram bars. This typically indicates that the momentum is weak and the market is awaiting a signal. However, the HBAR price is stable, but there is no strong force yet.
_****Here’s Where Ripple’s XRP Price Could Be Headed This New Week**
Hedera Price Targets to Watch This Week
If HBAR stays above $0.095 and moves up, $0.11 is the first level to watch. After that, $0.12 is the next area where price struggled before.
If the buying interest is able to overcome the $0.12 level, a move towards $0.14 may be expected.
However, failure to hold above $0.095 could see the HBAR price could return towards $0.085, with the stronger level at $0.072 yet to be tested.
For now, HBAR is trading in a tight range. A decisive break above $0.11 or below $0.095 is likely to determine just how high, or how low, Hedera will go this week.
Disclaimer: The information on this page may come from third parties and does not represent the views or opinions of Gate. The content displayed on this page is for reference only and does not constitute any financial, investment, or legal advice. Gate does not guarantee the accuracy or completeness of the information and shall not be liable for any losses arising from the use of this information. Virtual asset investments carry high risks and are subject to significant price volatility. You may lose all of your invested principal. Please fully understand the relevant risks and make prudent decisions based on your own financial situation and risk tolerance. For details, please refer to
Disclaimer.
Related Articles
BTC 15-minute chart slightly down 0.57%: leveraged long positions passively cut risk and macro sentiment disturbances drive volatility
2026-04-12 12:45 to 13:00 (UTC), the BTC price range was 71081.7 to 71493.2 USDT, with an amplitude of 0.58%. Within 15 minutes, the return recorded was -0.57%. During the period of unusual activity, market volatility increased somewhat, risk sentiment warmed up, and overall attention rose; however, there was no extreme surge in volume or a sudden drop in liquidity.
The main driver behind this unusual activity is that, under the leverage structure, long positions were reduced passively. Recently, the funding rate for perpetual contracts turned from negative to positive. Leverage among longs in the market accumulated; the price dipped slightly, triggering liquidations of some leveraged long positions and sell orders for position closures, resulting in
GateNews1h ago
Analyst: Bitcoin’s current pullback is relatively mild compared with past ones, but the bottom has not been confirmed yet.
Crypto analyst Axel Adler Jr said the current Bitcoin pullback is smaller than historic bearish-market levels, but a bottom has not yet been confirmed. He believes the market is still in a mild bear phase, and that a true recovery will require patience and waiting.
GateNews3h ago
Bitcoin long-term holdings increased to 12.4 million coins, and the 30-day change has remained positive.
CryptoQuant analyst Darkfost says the Bitcoin market is entering an early stabilization phase, with stronger long-term holding behavior. The amount of BTC held for more than a year has increased, and investors are more inclined to hold than to distribute. This suggests the market is transitioning toward long-term conviction; the current trend is viewed as an early stability signal, but it needs longer-term confirmation.
GateNews4h ago
XRP Payments Fall 77% as Price Eyes End to Rally - U.Today
XRP's on-chain payment volume has dropped 77% to 86 million, signaling bearish momentum as its price stagnates below $1.35. This decline has raised investor concerns about potential volatility in the crypto market.
UToday6h ago
Shiba Inu Supply Locked Away as Ryoshi's Earlier Move Seals SHIB's Fate - U.Today
Shibizens highlights Shiba Inu's tokenomics, detailing how founder Ryoshi locked 50% of the supply in Uniswap for liquidity. This approach, including a significant burn by Vitalik Buterin, aimed for a fair launch, impacting SHIB's market price amid recent inflation data.
UToday7h ago
BTC Whale Inflows Drop, LTHs Accumulate Strongly
Recent data shows Bitcoin whale inflows to exchanges have dropped to below $3 billion, indicating reduced selling pressure. Meanwhile, long-term holders have accumulated $49 billion in Bitcoin, signaling a market transition. This shift suggests potential stability and reduced volatility, although macro factors could still affect prices.
Coinfomania8h ago
