
The LINK price is starting to catch traders’ interest again, and honestly, it makes sense. After months of grinding lower, Chainlink is now sitting right near the bottom of a major macro range, and that’s usually where things start getting interesting.
Crypto expert Lucky summed up the mood perfectly with a simple question: is $LINK quietly getting ready for a comeback? And when you look at the charts, it’s not hard to see why that idea is floating around again.
- Monthly Chart Shows LINK Price Still Stuck in a Massive Range
- Daily Chart: LINK Price Is Sitting Right in a Demand Zone
- LINK Price Outlook: Quiet Setup or Something Bigger Brewing?
Monthly Chart Shows LINK Price Still Stuck in a Massive Range
On the monthly timeframe, the LINK price has basically been trapped in a huge consolidation zone for years now. The chart shows that impulse move into the 2021 peak, followed by a long stretch of sideways action where price has been capped inside a broad range.
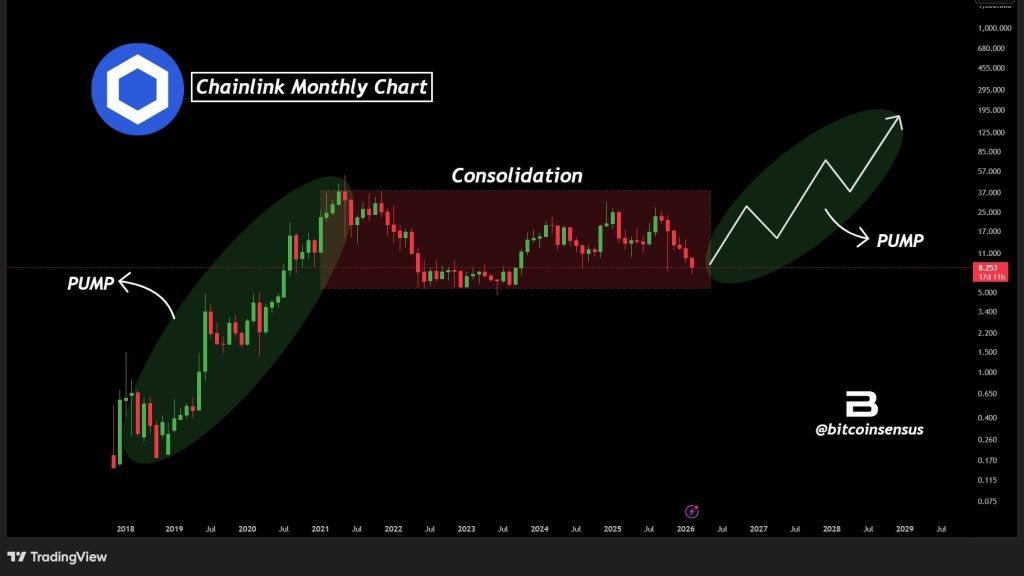
Source: X/@Bitcoinsensus
The key detail is where LINK sits right now, near the lower end of that range. That’s important because these lower range zones are often where price compresses before the next major expansion phase begins.
Bitcoinsensus pointed out this same structure, calling it a macro consolidation that may be nearing its end. The idea is pretty simple: big impulse, long reset, then eventually the next wave higher once the range finally breaks.
Daily Chart: LINK Price Is Sitting Right in a Demand Zone
Zooming into the daily chart shared by Lucky, the LINK price is sitting inside a clear demand zone after months of downtrend pressure. That falling resistance line has controlled price for a long time, but now LINK is compressing right near support, which is usually where sellers start losing their grip.
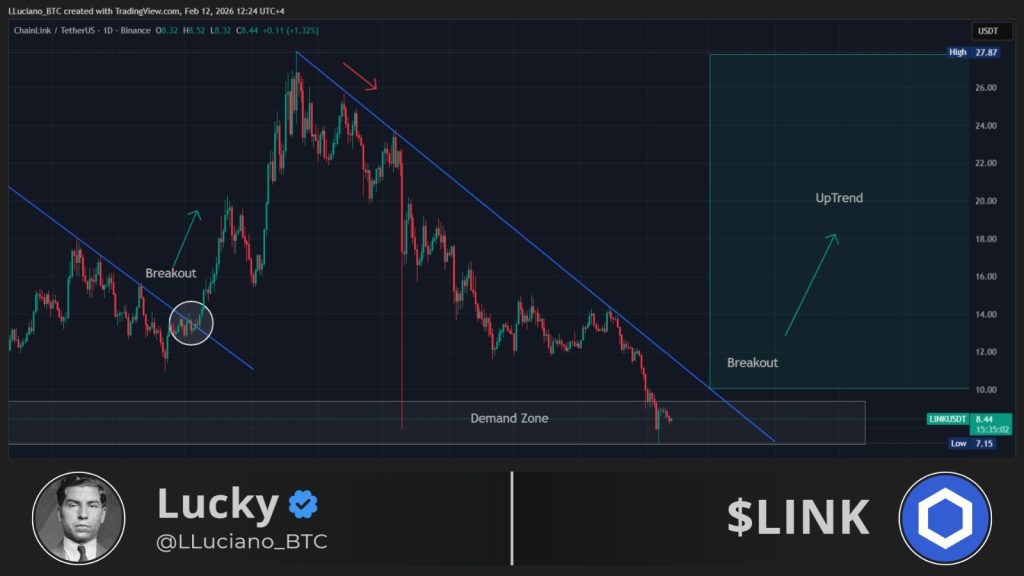
Source: X/@LLuciano_BTC
The chart also highlights a breakout area above the downtrend line, and if the LINK price can reclaim momentum and push out of this base, the upside starts opening up quickly. The target zone on the chart stretches toward the $20–$27 region, which would be a full recovery move back into the upper structure.
Top Analyst Says Chainlink (LINK) Price Could 17x From Here – The $100 Chart Setup Explained_**
LINK Price Outlook: Quiet Setup or Something Bigger Brewing?
Right now, the LINK price is still in the “boring” phase of the cycle, that part where everything feels slow right before it stops being slow. Macro consolidation near range lows, compression on the daily chart, and a clear breakout trigger overhead are exactly the kind of setup traders like to spot early.
If LINK breaks out of its downtrend and starts reclaiming higher levels, this could turn into one of those comeback charts people only appreciate after the move is already gone. For now, Chainlink is sitting at a major decision point. And the next move could end up being a lot bigger than it looks today.
Disclaimer: The information on this page may come from third parties and does not represent the views or opinions of Gate. The content displayed on this page is for reference only and does not constitute any financial, investment, or legal advice. Gate does not guarantee the accuracy or completeness of the information and shall not be liable for any losses arising from the use of this information. Virtual asset investments carry high risks and are subject to significant price volatility. You may lose all of your invested principal. Please fully understand the relevant risks and make prudent decisions based on your own financial situation and risk tolerance. For details, please refer to
Disclaimer.
Related Articles
ETH 15-minute drop of 0.66%: short-term holders selling off in tandem with exchange net inflows amplifies the selling pressure
2026-04-12 22:00 to 22:15 (UTC), ETH showed a clear downward move in a highly liquid environment. The candlestick chart indicates a return of -0.66%, with price fluctuations ranging from 2186.76 to 2211.25 USDT, and a swing amplitude of 1.11%. Market attention rose rapidly, short-term sentiment turned cautious, and volatility intensified.
The main driving factors behind this unusual move are a sharp increase in exchange net inflows and concentrated selling by short-term holders. On-chain data shows that over the past 24 hours, net inflow of ETH into exchanges totaled 9,567.65 ETH, suggesting that a large amount of capital entered the market in the short term, potentially increasing selling pressure.
GateNews1h ago
CTSI Price Soars 17.57%: Institutional Interest Ramps Up
Amid a crypto market downturn, CTSI surged 17.57% to $0.03626 in an hour, driven by high trading volume and institutional interest in altcoins. Traders are now watching key support and resistance levels for future price movements.
Coinfomania3h ago
Bitcoin falls below 71,500 USD, U.S.-Iran talks remain deadlocked, and the Strait of Hormuz becomes the biggest point of contention
On April 11, the U.S. and Iran began 20 hours of negotiations in Pakistan. The core issue was freedom of passage through the Strait of Hormuz. After Bitcoin briefly rose to $73,800, it quickly fell back to $71,557. The U.S. side took a hardline stance, demanding that Iran open the strait, while Iran insisted that easing restrictions must wait until a comprehensive agreement is reached. The two sides have not yet reached a consensus.
動區BlockTempo7h ago
Crypto Market Maintains Steady Growth Trajectory As Top Assets Show Gains
The crypto market continues to grow, with a market cap of $2.44T and Bitcoin and Ethereum showing slight increases. Top gainers include $GPM and $BASE. Meanwhile, DeFi TVL declined, NFT sales rose, and notable developments include a trader's significant loss and a push for regulatory clarity in Congress.
BlockChainReporter9h ago
BTC 15-minute chart slightly down 0.57%: leveraged long positions passively cut risk and macro sentiment disturbances drive volatility
2026-04-12 12:45 to 13:00 (UTC), the BTC price range was 71081.7 to 71493.2 USDT, with an amplitude of 0.58%. Within 15 minutes, the return recorded was -0.57%. During the period of unusual activity, market volatility increased somewhat, risk sentiment warmed up, and overall attention rose; however, there was no extreme surge in volume or a sudden drop in liquidity.
The main driver behind this unusual activity is that, under the leverage structure, long positions were reduced passively. Recently, the funding rate for perpetual contracts turned from negative to positive. Leverage among longs in the market accumulated; the price dipped slightly, triggering liquidations of some leveraged long positions and sell orders for position closures, resulting in
GateNews11h ago
Analyst: Bitcoin’s current pullback is relatively mild compared with past ones, but the bottom has not been confirmed yet.
Crypto analyst Axel Adler Jr said the current Bitcoin pullback is smaller than historic bearish-market levels, but a bottom has not yet been confirmed. He believes the market is still in a mild bear phase, and that a true recovery will require patience and waiting.
GateNews12h ago
