Gate Research: ETH Nearing Key Resistance, MACD Trend Strategy Achieves 150%+ Return
Summary
- BTC is consolidating at high levels with a stable structure, while ETH continues to climb steadily toward 4,000 USDT, showing relatively stronger short-term performance. In terms of volatility, BTC remains stable, whereas ETH’s volatility has increased, indicating rising market divergence.
- Long-short ratios and funding rates have retreated to a neutral-to-cautious range. Open interest remains elevated, with ETH leverage expanding more significantly.
- The liquidation structure remains orderly. On July 23, long liquidations totaled $630 million, representing a high-level shakeout that released upward momentum.
- The broader market maintains a structurally bullish bias. While capital participation is cautious, the market has not deviated from its underlying trend, suggesting potential for further upside.
- On the quant strategy front, the MACD trend-following strategy achieved over 150% return on the SUI token, demonstrating strong short-term trading potential.
Market Overview
To systematically present the recent shifts in capital behavior and trading structure within the cryptocurrency market, this report analyzes five key dimensions: price volatility of Bitcoin and Ethereum, the long-short ratio (LSR), futures open interest, funding rates, and liquidation data. Together, these indicators provide a comprehensive view of current market dynamics, capturing price trends, investor sentiment, and risk conditions. The following sections will examine the latest developments in each metric since July 15.
1. Price Volatility Analysis of Bitcoin and Ethereum
According to CoinGecko data, from July 15 to 28, the crypto market experienced high-level consolidation, with both BTC and ETH entering sideways trading ranges after breaking through their recent highs. While short-term momentum softened, the overall structure remained bullish.
For BTC, after hitting an all-time high of 123,000 USDT on July 14, the price entered a consolidation phase, repeatedly testing the 119,000 USDT level. On the technical front, short-term moving averages and the MA30 became tightly aligned. Although MACD briefly formed a bullish crossover, its histogram momentum weakened, and the price lacked the volume needed for a sustained breakout. Trading volume declined steadily following the peak, indicating reduced willingness to chase prices. Nonetheless, key support remained firm, with strong buying interest observed in the 115,000–116,000 USDT zone.【1】【2】【3】
From a fundamental perspective, the Bitcoin ecosystem continues to expand. Annual on-chain transaction volume has officially surpassed Visa’s, signaling growing recognition of BTC’s utility in global capital markets. Meanwhile, tightening on-chain liquidity and increasing institutional holdings reinforce BTC’s role as “digital gold” and a core collateral asset. Merlin Chain’s recent 2.0 upgrade aims to enhance Bitcoin’s yield capabilities and cross-chain functionality, potentially unlocking further real-world applications and driving long-term value revaluation.
ETH, in contrast, has shown a more consistent upward trend over the past two weeks. Starting around 3,550 USDT, ETH has steadily climbed along short-term moving averages, approaching the 4,000 USDT level by July 28 with a structurally sound technical pattern. The MACD indicator continues to expand, and moving averages remain in a bullish configuration, indicating sustained momentum. While trading volume hasn’t surged dramatically, it has risen steadily, reflecting growing market participation.
In summary, since mid-July, the crypto market has entered a phase of high-level consolidation. BTC has stalled within a range after its breakout, with declining momentum and volume, though solid support and favorable fundamentals continue to underpin its long-term outlook. ETH, on the other hand, has demonstrated stronger continuity, with a well-structured climb along key technical levels and increasing investor interest, nearing the critical 4,000 USDT mark. Overall, despite the lack of immediate breakout momentum, major assets remain in healthy uptrends. Combined with ecosystem growth and rising institutional allocation, the bullish foundation remains intact, suggesting potential for a renewed upward move following this consolidation phase.
Figure 1: BTC has been consolidating near highs over the past two weeks, repeatedly facing resistance at 119,000 USDT, with weakening momentum; ETH has steadily climbed toward 4,000 USDT, showing stronger short-term performance and recovering market confidence.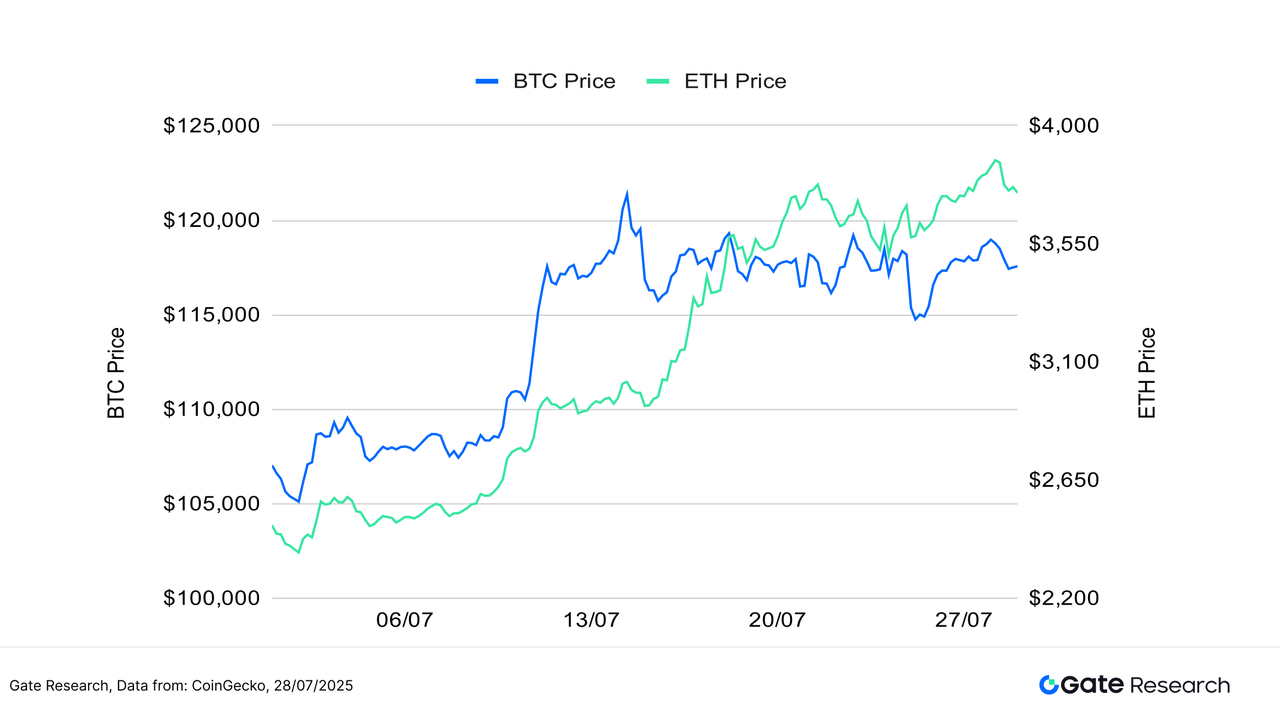
In terms of volatility, BTC has largely maintained a mild and steady fluctuation pattern, with only brief spikes on a few trading days. This suggests that major market participants are executing with a clear rhythm and that trend expectations remain relatively strong. In contrast, ETH has experienced several sharp upticks in volatility since mid-July—particularly around July 16 and July 25—indicating heightened market disagreement over its breakout direction and increased short-term trading activity.
Although the volatility of both assets remains within historically moderate-to-low ranges, ETH’s recent volatility surges reflect a more sensitive market sentiment. Its price appears more prone to amplified reactions driven by short-term news or capital flows. If trading volume continues to expand in tandem with volatility, it could trigger a directional breakout in ETH, warranting close monitoring to determine whether this volatility transitions into a sustained trend.
Figure 2: BTC volatility remains stable overall, while ETH shows repeated spikes in mid-to-late July, reflecting intensified short-term trading sentiment and growing uncertainty over directional bias.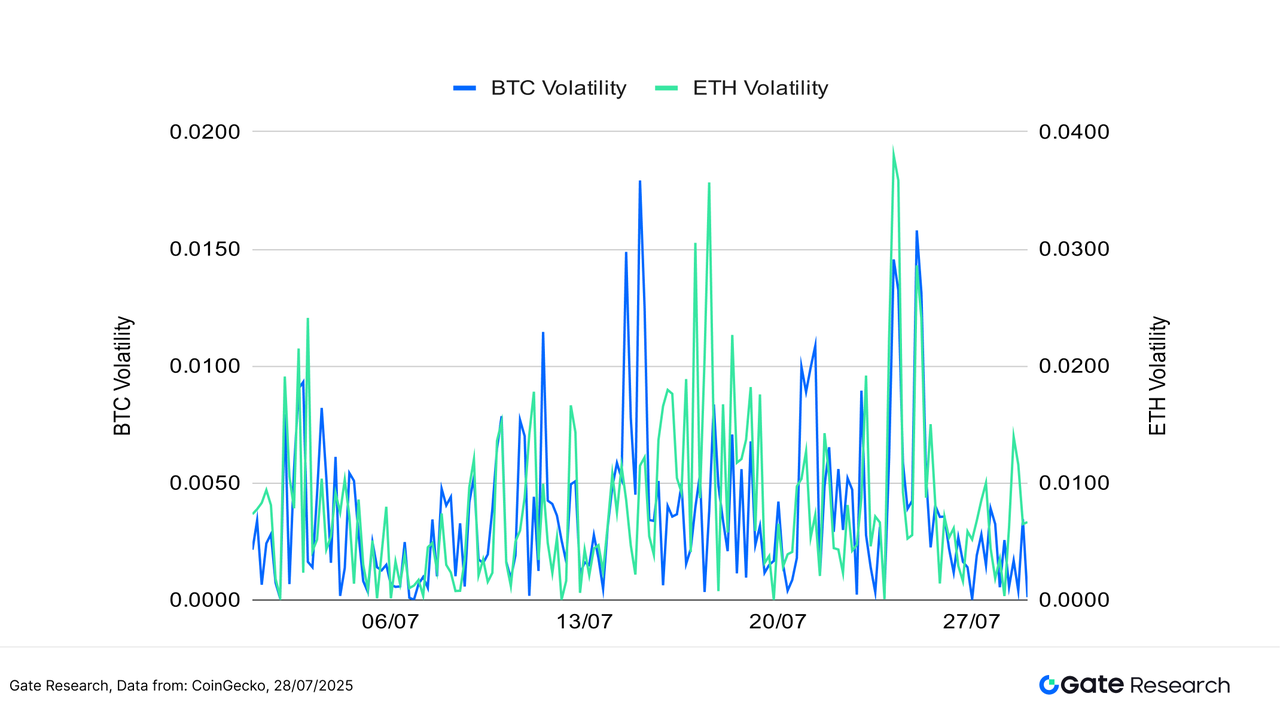
the past two weeks, the crypto market has largely remained in a consolidation phase near its recent highs. After reaching a new all-time high, BTC lacked further upward momentum and entered a sideways range, with both volume and volatility contracting. However, solid support at the lower bounds has kept its technical structure intact. ETH, on the other hand, has shown stronger performance, steadily climbing along its moving averages and approaching the 4,000 USDT mark.
In terms of volatility, BTC maintained a stable rhythm, while ETH saw a notable increase in fluctuations—highlighting growing market divergence and heightened short-term speculation. Overall, while short-term momentum has softened, the structural outlook for major assets remains healthy. Ongoing ecosystem development and capital participation continue to support the market. If price and volume begin to align, a new trend breakout could emerge in the near term.
1. Analysis of Long/Short Taker Size Ratio (LSR) for Bitcoin and Ethereum
The Long/Short Taker Size Ratio (LSR) is a key indicator that measures the volume of aggressive buying versus aggressive selling, often used to gauge market sentiment and trend strength. An LSR greater than 1 indicates that the volume of market buys (aggressive longs) exceeds that of market sells (aggressive shorts), suggesting a bullish market bias.
According to Coinglass data, BTC’s Long-Short Ratio (LSR) has been fluctuating downward, even as its price remains in a high-range consolidation. The LSR repeatedly dipped below 1 and fell under 0.90 on July 28, indicating a decline in bullish conviction at higher levels. This suggests that despite BTC’s strong technical structure, market enthusiasm has cooled, and short-term capital has turned more cautious. Overall, the drop in LSR following BTC’s new highs reflects a weakening of short-term optimism, with some investors opting to reduce positions or stay on the sidelines.【4】
ETH’s LSR, meanwhile, has shown a clear divergence from its price trend. Despite steadily climbing toward 4,000 USDT since July 15, the LSR has gradually declined since mid-July, hovering around 0.95 and at times falling below 0.90. This signals a cautious stance among traders, suggesting doubts about the sustainability of ETH’s rally. The persistently bearish LSR reflects short-term speculative interest in testing short positions, highlighting a disconnect between price action and market sentiment.
In summary, while BTC and ETH have both remained near their recent highs, their declining LSRs reveal rising market indecision and increased caution in capital deployment. In the short term, whether the LSRs can rebound will be a key indicator for gauging the continuation of the upward trend.
Figure 3: BTC Long-Short Ratio declines during high-level consolidation, indicating weakening buying interest.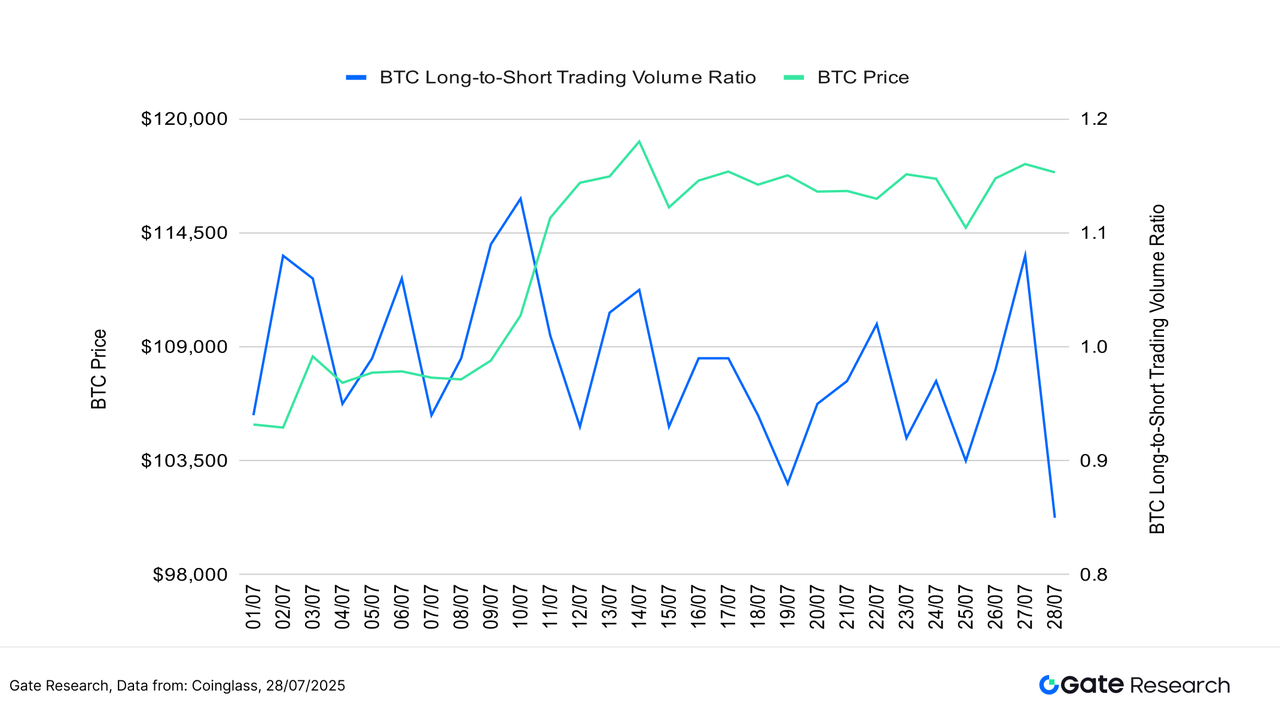
Figure 4: ETH Long-Short Ratio Remains in Bearish Territory, Reflecting Cautious Capital Participation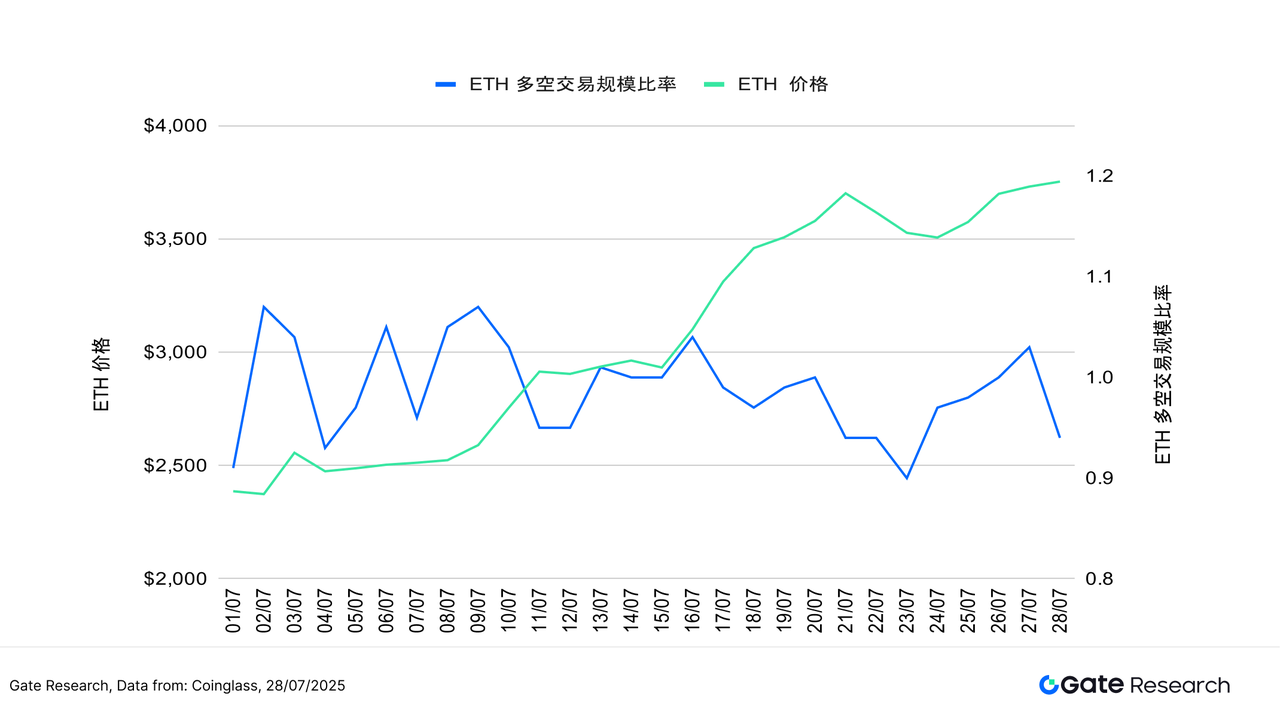
2. Open Interest Analysis
According to Coinglass data, open interest in BTC and ETH futures has remained elevated and volatile, suggesting that leveraged capital, after aggressively entering earlier, is now either adopting a wait-and-see approach or engaging in high-level positioning. Since mid-July, BTC open interest has repeatedly tested the $85–88 billion range without a clear breakout but remains near one-month highs. ETH futures open interest, on the other hand, has shown steady growth—surpassing $50 billion in mid-July and reaching approximately $57 billion by July 28, marking a new year-to-date high.【5】
Notably, ETH’s open interest has been rising at a faster pace than BTC during the second half of July, indicating greater market willingness to take leveraged bets on ETH’s future performance. This trend aligns with ETH’s gradual spot price increase and rising investor enthusiasm.
Overall, both BTC and ETH are experiencing sustained activity from leveraged capital, reflecting a recovery in market risk appetite. However, with both price levels and leverage exposure near elevated zones, increased market volatility could trigger concentrated liquidations. It is advisable to closely monitor changes in open interest and liquidation risk to guard against sudden shifts in market sentiment.
Figure 5: BTC and ETH Futures Open Interest Remains Elevated; Leverage Activity High with ETH Leading in Growth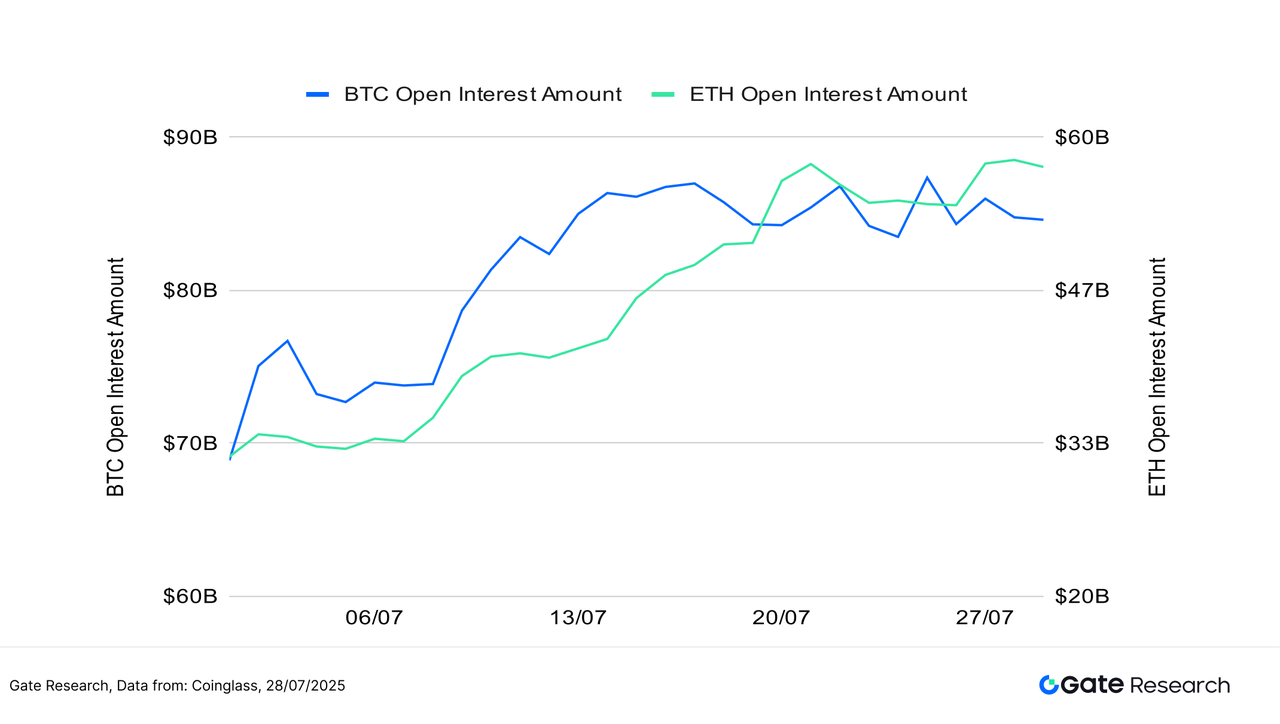
4. Funding Rate
Over the past two weeks, BTC and ETH funding rates have fluctuated slightly around the zero line, indicating a standoff between bullish and bearish forces. Investor appetite for chasing price increases remains limited, and leveraged capital has yet to enter the market in large scale. Despite prices holding at elevated levels, funding rates have not significantly increased, suggesting that the current rally is primarily driven by spot and low-leverage capital. This reflects a relatively stable market structure, helping to mitigate short-term bubble risk.
From a trend perspective, ETH’s funding rate briefly turned negative several times during this period, most notably between July 24 and 26, when it dipped to nearly -0.015%. However, the rate quickly rebounded, without triggering mass liquidations or sharp price reversals, demonstrating the market’s resilience. BTC’s funding rate remained more stable and less volatile, indicating continued institutional and long-term investor preference. In contrast, ETH’s funding rate showed slightly higher volatility, reflecting differing market expectations and a more speculative trading tone.【6】【7】
Overall, while the funding environment has not strongly supported further upside, it also poses no major resistance. If funding rates turn positive and remain elevated—accompanied by a surge in trading volume—it would signal a potential acceleration in price momentum, making this a key trend to watch going forward.
Figure 6: BTC and ETH Funding Rates Fluctuate Around Zero; Market Participants Cautious, Leverage Yet to Expand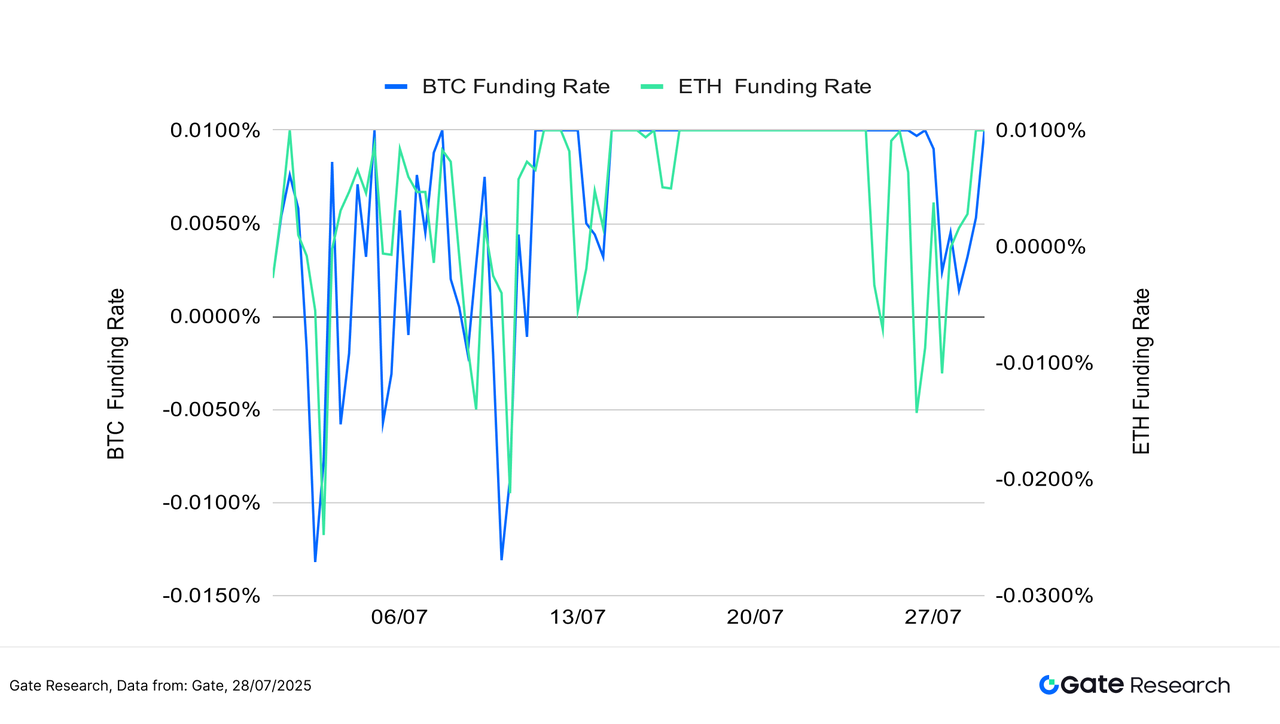
5. Cryptocurrency Liquidation Chart
According to data from Coinglass, the liquidation structure in the crypto derivatives market over the past two weeks has remained relatively balanced, with no signs of systemic cascades or large-scale forced liquidations. However, during periods of short-term volatility, localized liquidation spikes still occurred. On the long side, two significant liquidation events were recorded on July 18 and July 23, with the latter seeing long liquidations reach $630 million in a single day—the highest during this period. This indicates that leveraged long positions entered at high levels faced substantial pressure during market shakeouts, suggesting that while bullish momentum persists, the pace of upward movement has slowed noticeably.【8】
In contrast, short-side liquidations were relatively subdued, with a notable spike only on July 18 during a strong price surge. For the remainder of the period, short liquidations remained low, reflecting a more cautious approach by bearish traders. Attempts to “short the top” did not trigger widespread stop-outs, further highlighting the restrained positioning of the short side.
Overall, the current liquidation dynamics do not indicate systemic imbalance. The market continues to show healthy capital flows and position tension during high-level consolidation. Intermittent long liquidations help to cool down overheated sentiment and flush out weak hands, potentially laying the groundwork for renewed bullish momentum. If market volatility eases and liquidation frequency declines, this could create a firmer base for the next leg up.
Figure 7: Long Liquidations Peaked at $630M on July 23, Highlighting Pressure on High-Leverage Bullish Positions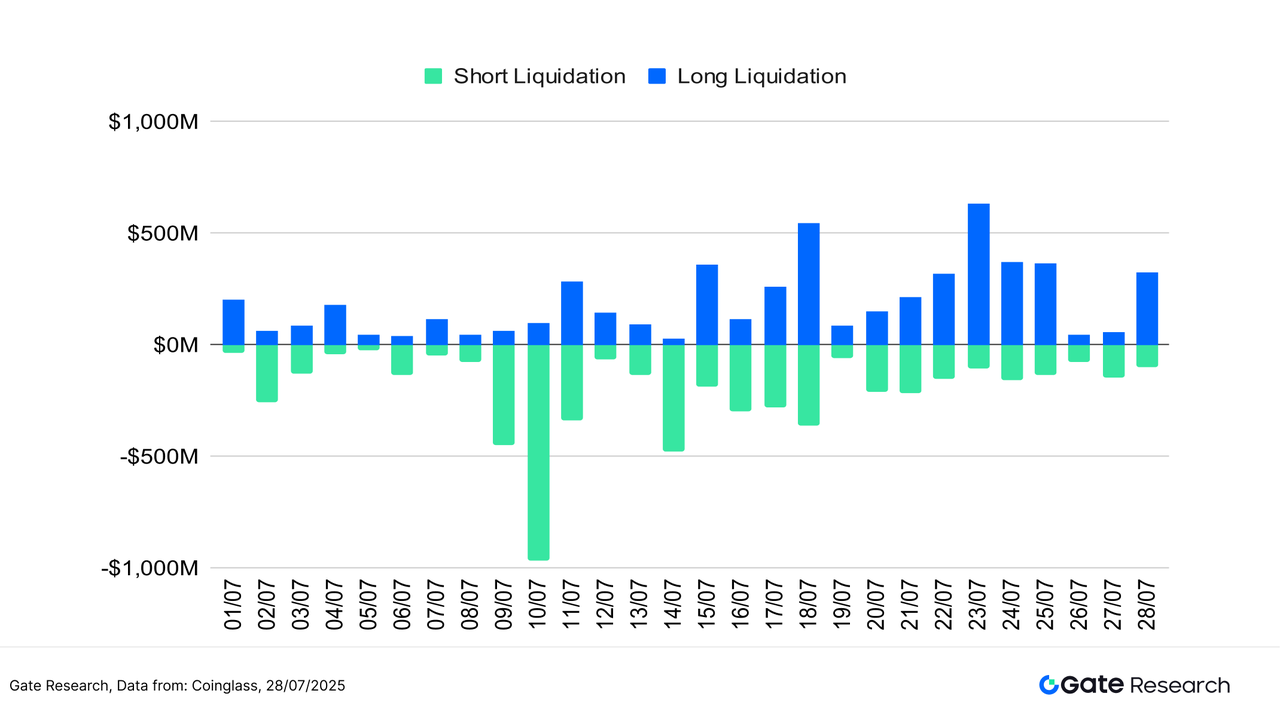
Against the backdrop of a structurally bullish market and restrained capital inflows, the foundation for continued gains in crypto assets remains intact. However, as the market enters a consolidation phase at elevated levels, short-term sentiment fluctuations have intensified, and both chasing rallies and shorting corrections now carry heightened risks. With market rhythms becoming more fragmented, investors must rely on more precise technical tools to manage trading timing and risk control effectively.
In light of this, the following section will focus on the MACD (Moving Average Convergence Divergence) indicator—one of the most widely used tools in quantitative technical analysis. We will explore its effectiveness in identifying trend reversals and generating actionable entry and exit signals during high-level consolidations and rotational market phases. Centered on the “MACD Trend Strategy,” we will conduct backtests across various tokens and market conditions to evaluate the strategy’s adaptability and consistency in trend-following, drawdown control, and mid-trend profit amplification.
Quantitative Analysis – MACD Trend Strategy
(Disclaimer: All forecasts in this article are based on historical data and market trends and are for informational purposes only. They should not be considered investment advice or a guarantee of future market performance. Investors should carefully assess risks and make prudent decisions when engaging in related investments.)
1. Strategy Overview
This strategy is based on the MACD (Moving Average Convergence Divergence) technical indicator, combining momentum reversal signals with risk management to execute trend-following trades. A buy signal is triggered when a bullish crossover occurs (MACD line crosses above the signal line), and fixed take-profit and stop-loss levels are used to manage risk, ensuring disciplined entry and exit. The strategy is particularly suited for identifying trend shifts following consolidation phases, aiming to capture the main segments of upward price movements.
The backtest focuses on the top ten cryptocurrencies by market capitalization (excluding stablecoins), covering major Layer 1 chains and highly liquid assets. This setup evaluates the strategy’s adaptability and effectiveness across different assets and market conditions, validating its feasibility and robustness for live trading deployment.
2. Core Parameter Settings

3. Strategy Logic and Operational Mechanism
Entry Condition
- When there is no existing position, a buy signal is triggered when the MACD line crosses above the signal line (bullish crossover), indicating strengthening momentum.
Exit Conditions
- MACD Reversal: A sell signal is triggered when the MACD line crosses below the signal line (bearish crossover), indicating a potential trend reversal.
- Stop-Loss Exit: If the price drops to the entry price × (1 -
stop_loss_percent), a forced stop-loss is triggered. - Take-Profit Exit: If the price rises to the entry price × (1 +
take_profit_percent), a take-profit exit is triggered.
Live Trade Example Chart
- Trade Signal Triggered
The chart below shows the SUI/USDT 1-hour candlestick on July 19, 2025, when a buy signal was triggered by the strategy. At that moment, the MACD line crossed above the signal line from below, forming a standard bullish crossover, which met the strategy’s condition for entering a long position based on strengthening momentum. Simultaneously, the price had moved above the short-term moving averages (MA5 and MA10), indicating a bullish shift in short-term structure, with the moving averages beginning to turn upward, further confirming the entry.
Trading volume increased during this period, accompanied by the MACD histogram flipping from negative to positive, clearly signaling a momentum reversal and reflecting improving market sentiment. As the price broke out of the previous consolidation range, the strategy initiated a long position and set a 1% fixed stop-loss and 15% fixed take-profit target, aiming to capture the subsequent upward trend. As shown in the chart, the signal effectively marked the beginning of a local uptrend, demonstrating the strategy’s responsiveness and effectiveness during early trend formation.
Figure 8: SUI/USDT Strategy Entry Illustration (July 19, 2025)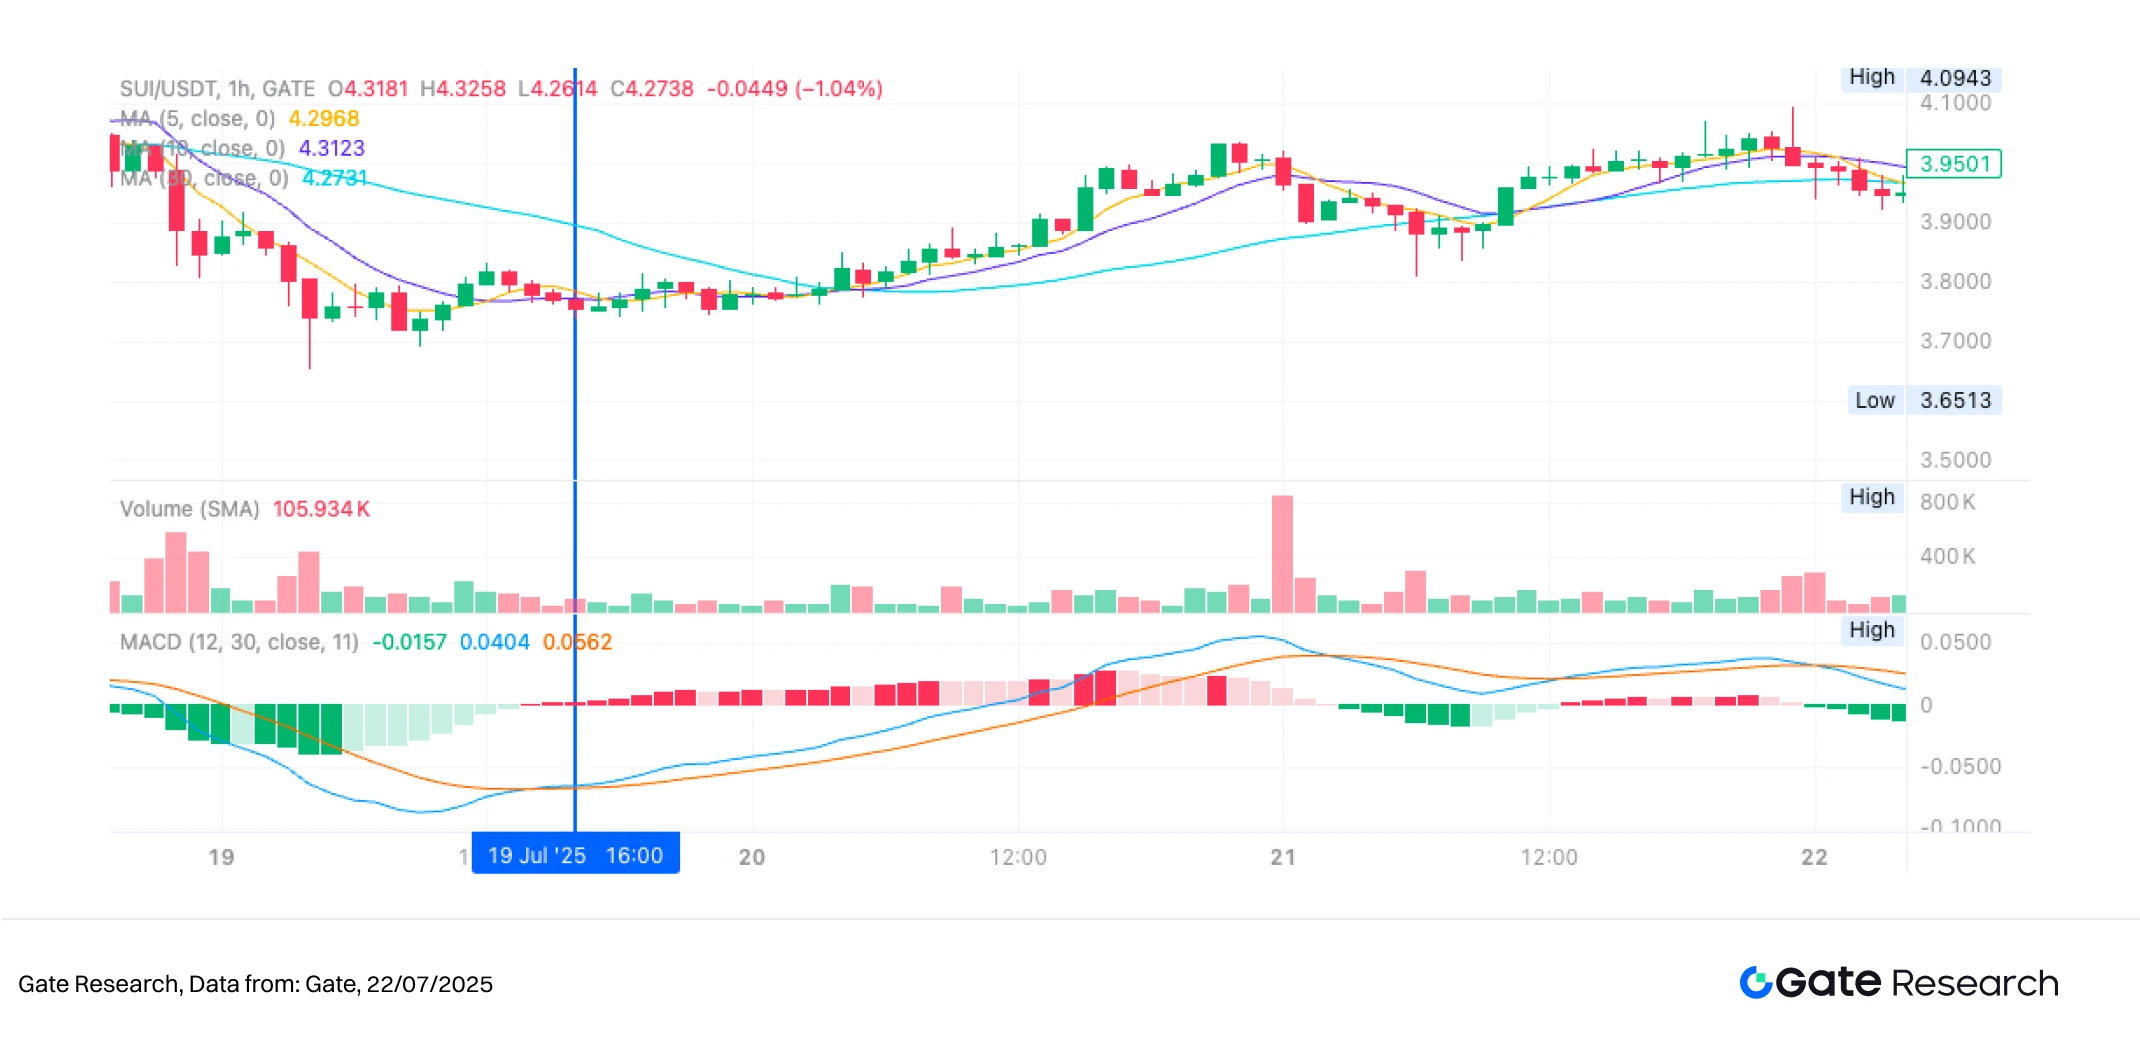
- Trade Execution and Outcome
On July 21, 2025, a bearish MACD crossover appeared on the SUI chart, prompting the strategy to trigger an exit signal and close the position. As shown in the chart, the MACD line crossed below the signal line from above, forming a classic sign of weakening trend momentum. At the same time, the histogram contracted, indicating fading momentum. Although the price remained above short-term moving averages, the upward momentum had slowed, with successive highs failing to break out significantly—suggesting a weakening bullish drive. Trading volume also lacked follow-through, reflecting limited market willingness to chase higher prices.
Under these conditions, the strategy identified the MACD bearish crossover as a forward-looking trend reversal signal and chose to exit before upward momentum fully exhausted, locking in gains from the prior range. This exit reflects the strategy’s trend-reversal risk management mechanism, which allows it to exit based on momentum indicators before stop-loss or take-profit levels are hit—effectively avoiding potential drawdowns from high-level consolidation or reversals. Incorporating additional metrics such as trend strength or volume signals in the future may further enhance exit precision and profit retention.
Figure 9: SUI/USDT Strategy Exit Illustration (July 21, 2025)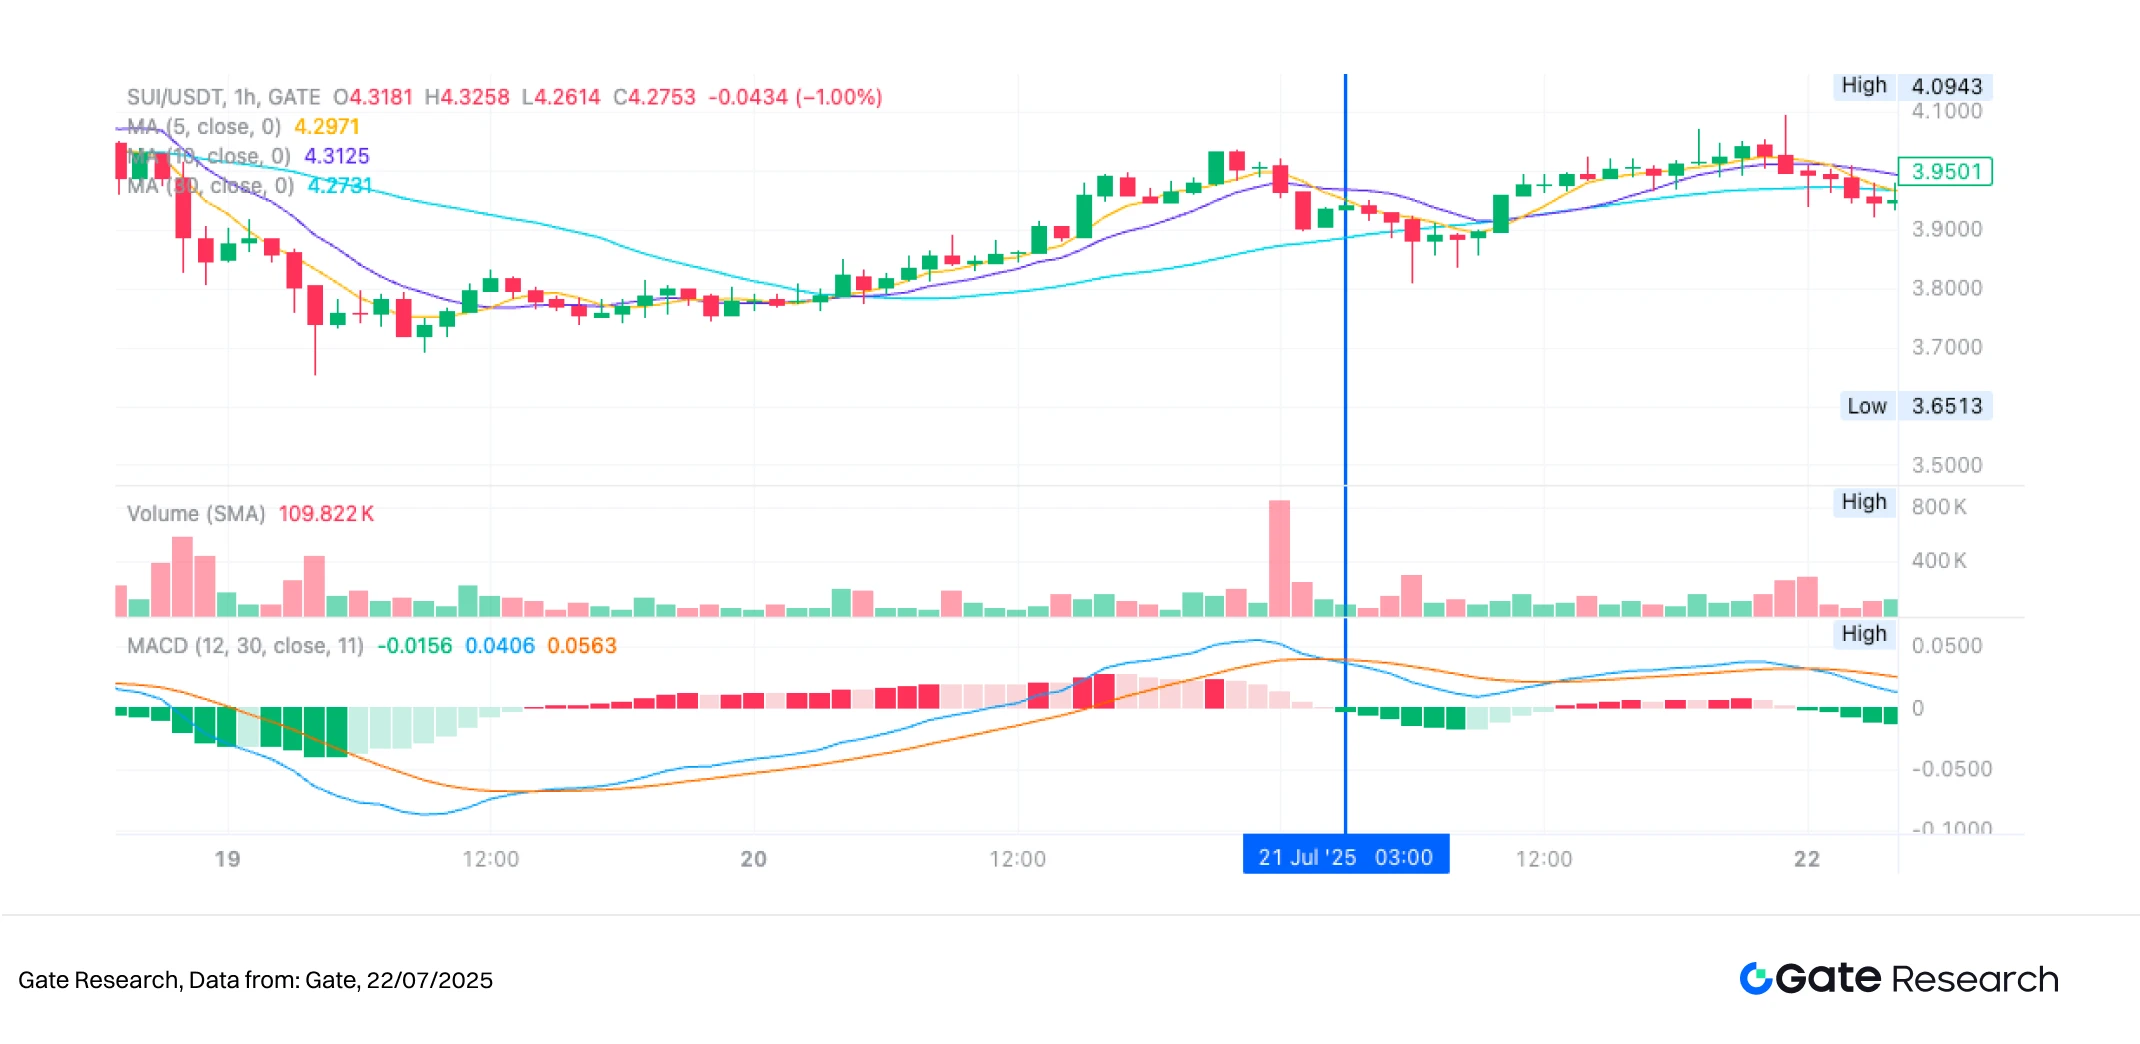
Through the above case study, we clearly demonstrate the entry and exit logic and dynamic risk management mechanism of a trend-following strategy based on the MACD indicator. The strategy takes the MACD bullish crossover as a signal of strengthening momentum to initiate long positions, and uses fixed take-profit and stop-loss levels to manage risk effectively. When a bearish crossover appears and momentum weakens, it exits the position in a timely manner, locking in partial gains from the previous trend.
While controlling drawdowns, the strategy successfully avoids profit erosion that often occurs during high-level consolidation, showcasing its defensive capability and trading discipline during trend exhaustion. This case not only validates the MACD strategy’s executability and stability in live market conditions, but also provides empirical support for future optimization through trend strength filters, volume-price confirmation, or multi-factor signal integration.
4. Practical Backtesting Example
Backtest Parameter Settings
To identify the optimal parameter combination, we conducted a systematic grid search across the following ranges:
macd_fast:8 to 15 (step size: 2)macd_slow:20 to 31 (step size: 2)macd_signal:5 to 13 (step size: 2)stop_loss_percent:1% to 2% (step size: 0.5%)take_profit_percent:10% to 16% (step size: 5%)
Using the top 10 cryptocurrencies by market cap (excluding stablecoins) as test assets, this study backtested hourly candlestick data from May 2024 to July 2025. A total of 384 parameter combinations were evaluated. The five combinations with the highest annualized return were selected as the top performers.
Evaluation metrics included annualized return, Sharpe ratio, maximum drawdown, and ROMAD (Return Over Maximum Drawdown), offering a comprehensive assessment of the strategy’s stability and risk-adjusted performance across different market conditions.
Figure 10: Performance Comparison of the Top 5 Parameter Sets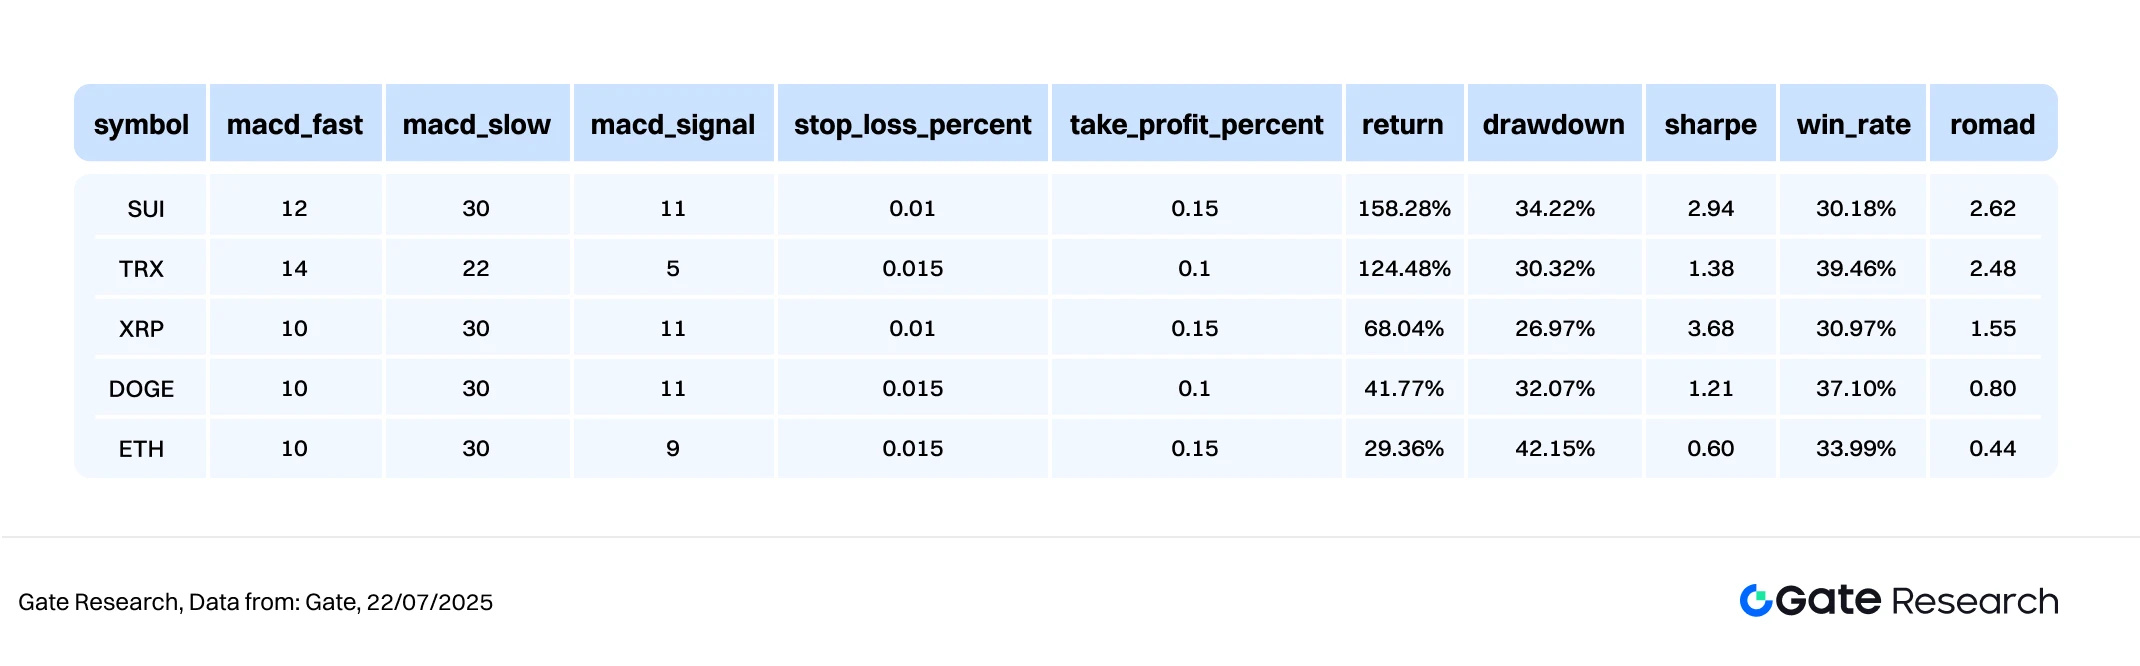
Strategy Logic Explanation
When the algorithm detects the MACD line crossing above the signal line (i.e., a golden cross), it is interpreted as a sign of strengthening market momentum and a potential transition into an upward trend. The strategy immediately triggers a buy order upon this signal. This logic is designed to capture critical turning points at the early stages of a trend, using the MACD indicator to confirm a shift from consolidation to directional movement.
After entry, the system applies fixed take-profit and stop-loss thresholds to enhance risk control. If the price reaches the predefined profit target or drops below a certain percentage of the entry price, the system automatically executes an exit, securing profits or limiting losses in a disciplined manner.
For example, using SUI, the following parameter settings are applied:
macd_fast\= 12macd_slow\= 30macd_signal\= 11stop_loss_percent= 1%take_profit_percent= 15%
This logic combines breakout confirmation with fixed risk control rules, making it well-suited for trending markets with clear swing structures. It aims to follow the trend while effectively limiting drawdowns, thereby improving the stability and overall quality of returns.
Performance and Results Analysis
The backtest period spans from May 2024 to July 2025. The strategy, based on MACD golden cross entries and fixed take-profit/stop-loss exits, was applied to the top 10 crypto assets by market cap (excluding stablecoins). Overall, the strategy outperformed BTC and ETH buy-and-hold benchmarks in cumulative returns, demonstrating strong momentum-tracking capabilities and effective risk management.
As shown in the chart, SUI and TRX produced the strongest performance, with steadily rising equity curves and cumulative returns exceeding 100%. The strategy successfully captured multiple upward waves by entering early during trend initiations and exiting at profit targets. SUI delivered the most consistent results, steadily climbing since October 2024 and hitting a strategy peak by mid-2025, ranking first among all tested assets.
In contrast, the buy-and-hold approach exhibited significantly higher volatility, with ETH experiencing a peak drawdown of over 50% during the same period—highlighting the risks of long-term holding in highly volatile markets. The MACD strategy, by contrast, exited during consolidations and pullbacks, effectively defending against downturns and enabling steady capital growth.
Furthermore, the strategy also performed well on mid-to-high volatility assets such as DOGE and XRP, capturing bullish moves while avoiding major losses during deep corrections.
In summary, the MACD golden cross strategy with fixed stop-loss and take-profit demonstrated strong performance in terms of profitability, drawdown control, and adaptability across different tokens, making it valuable for real-world deployment. Future enhancements could include dynamic trailing take-profit, volume-based filters, or trend confirmation indicators to further improve responsiveness and trading efficiency.
Figure 11: One-Year Cumulative Return Comparison – Top 5 Parameter Sets vs. BTC and ETH Buy-and-Hold Strategies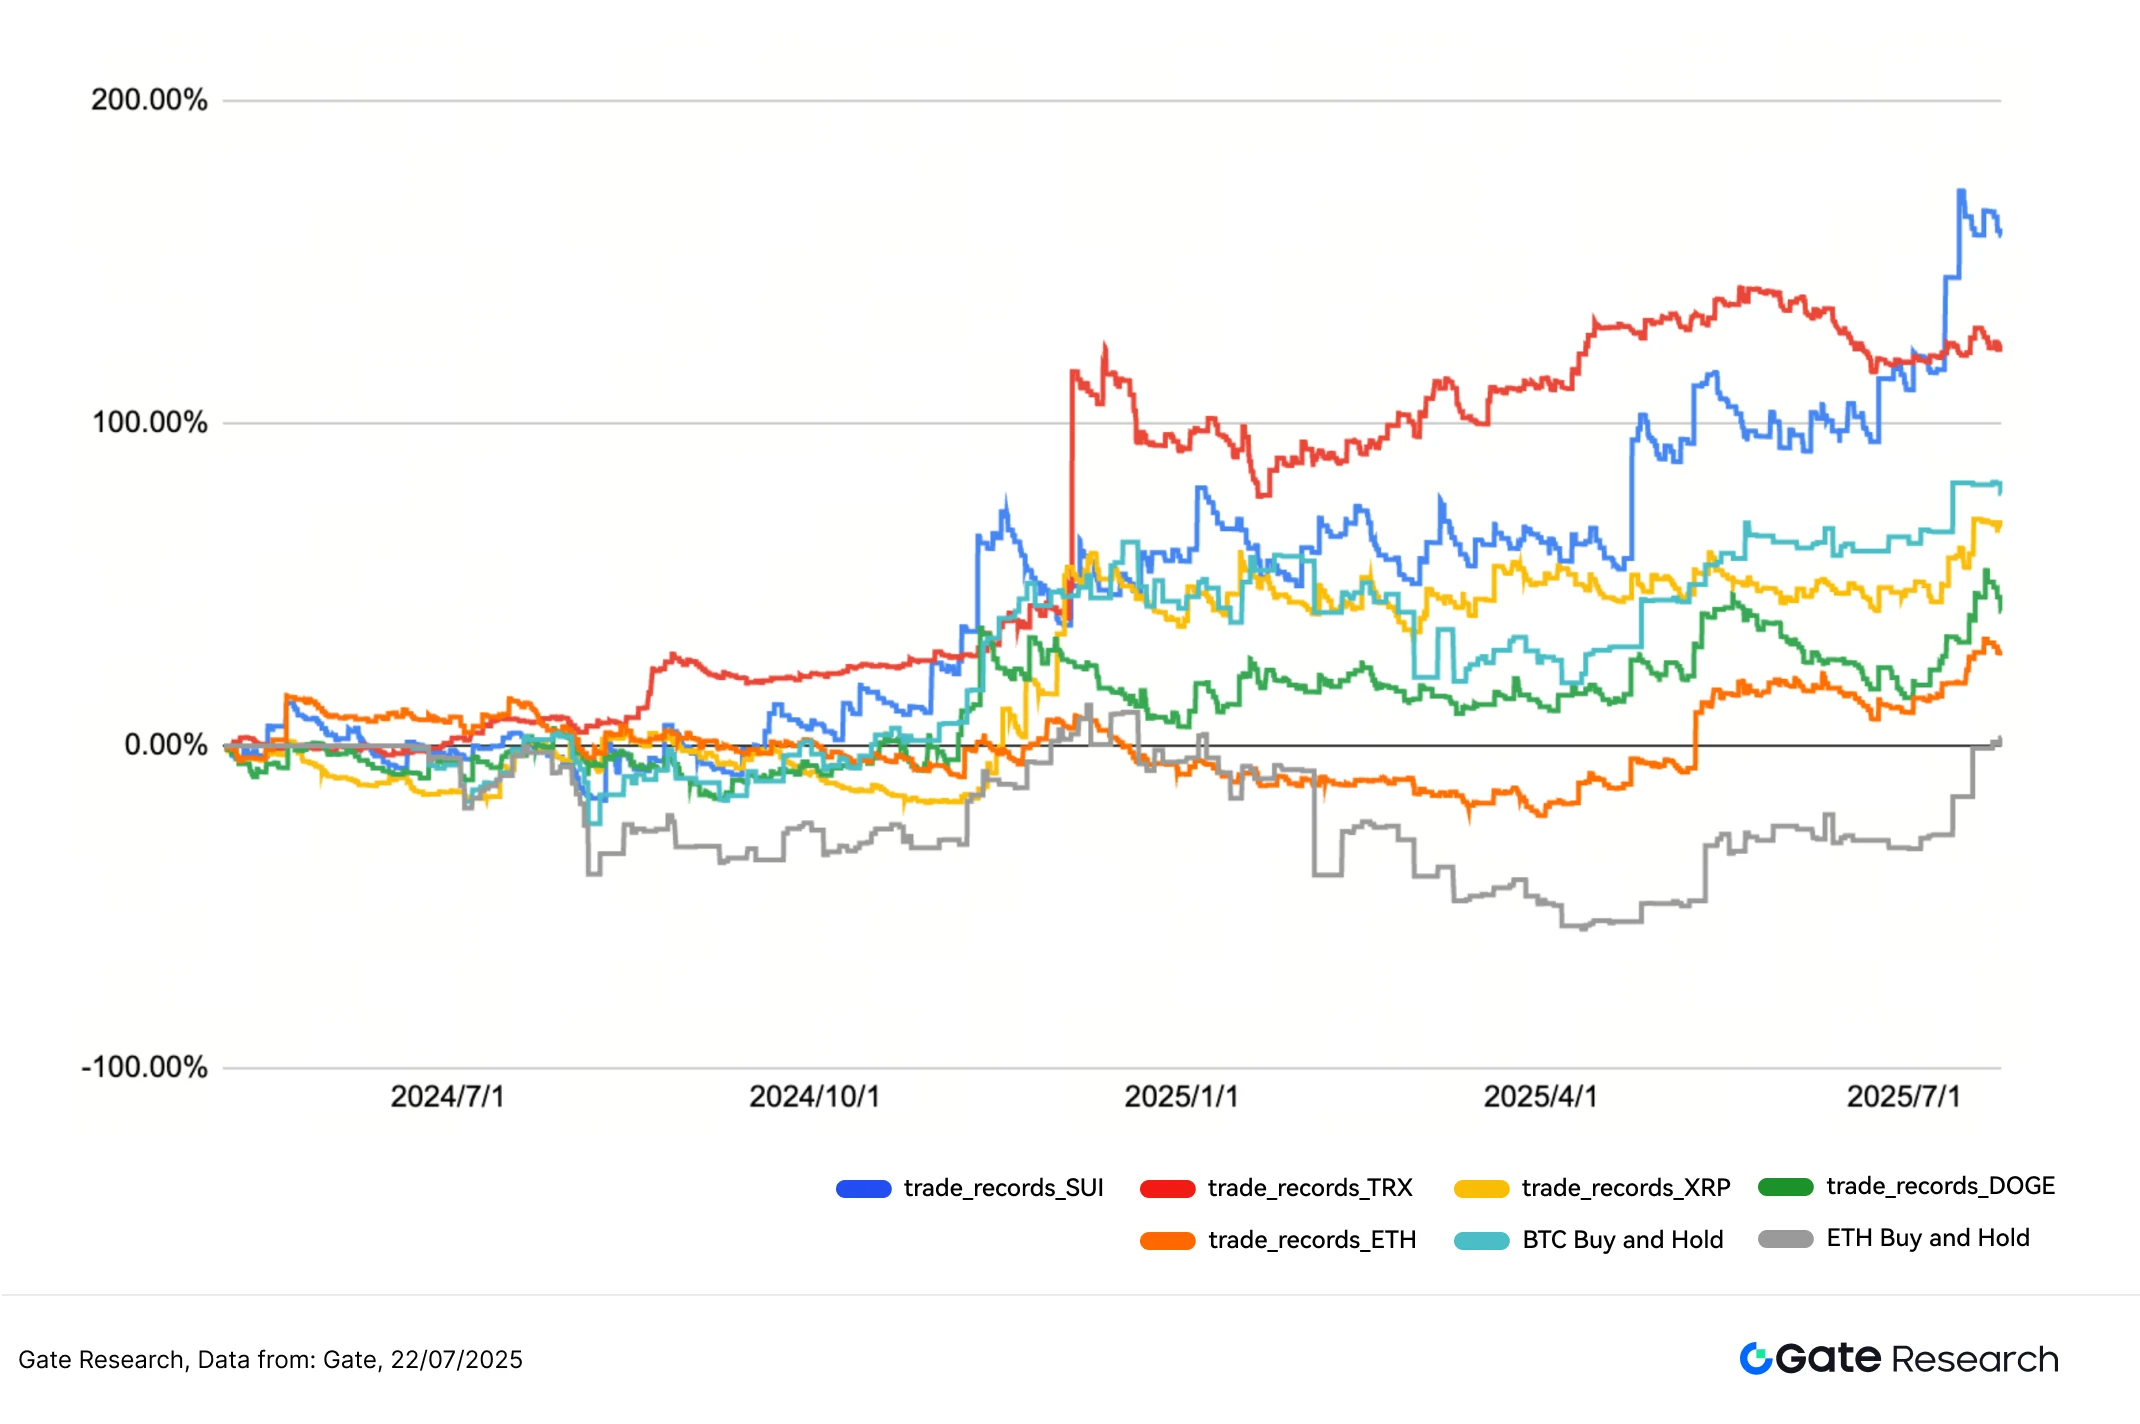
1. Strategy Summary
This strategy is built upon the MACD indicator to define entry and exit rules. By detecting golden cross signals, it identifies potential trend initiations and combines them with fixed take-profit and stop-loss mechanisms. The strategy has demonstrated robust risk control and consistent profit growth across a range of major crypto assets. During the backtest period, it effectively captured key turning points at the early stage of trends, especially under volatile or trend-reversal conditions, and significantly outperformed the traditional buy-and-hold approach.
Among the backtested assets, SUI and TRX stood out with cumulative returns exceeding 100%, with SUI achieving the strongest long-term performance across all tested coins. In contrast, the strategy effectively avoided deep drawdowns that affected assets like ETH during holding periods, further validating its stability and reliability in live trading environments.
Notably, although the strategy’s win rate across most tokens was below 50%, its disciplined entry and exit rules, combined with an asymmetric risk-reward structure, allowed for consistent profit accumulation by limiting losses and letting winners run. This highlights the critical role of risk management and position sizing in low-win-rate strategies.
Overall, the MACD trend-following strategy strikes a strong balance between profitability, drawdown control, and capital efficiency. It is especially well-suited for mid-to-high volatility markets where trends are unclear. Future enhancements may include volume confirmation, moving average filters, or multi-timeframe signal resonance, enabling further refinement and expansion into a multi-factor, multi-asset quantitative strategy framework.
Conclusion
From July 15 to July 28, 2025, the cryptocurrency market maintained a structurally bullish bias, with major assets consolidating near recent highs. Technical patterns and fundamental conditions remained healthy. However, key indicators such as long-short ratios, funding rates, and liquidation structures suggested cautious short-term sentiment, with a conservative pace of capital inflows and subdued leverage momentum. Despite BTC and ETH holding at elevated levels, the market exhibited a tug-of-war between bulls and bears, with price action shifting toward range-bound, tactical trading.
The next market phase will heavily depend on further developments in liquidity and trading structure—especially whether rising volumes, recovering funding rates, and stable positioning can act as catalysts for trend continuation. A breakout from the current range, accompanied by strengthening technical indicators, could trigger a new upward cycle for major assets. On the other hand, prolonged consolidation with intensifying market disagreement could lead to a corrective phase or a rotation.
In this pivotal stage—bullish but increasingly fragmented—short-term strategies must focus on timing precision and risk control. Flexibility, trend tools, and position management are key to navigating uncertainty. Within this context, the MACD-based trend strategy—featuring golden cross entries and fixed-risk exits—demonstrates strong medium-term trading advantages. By leveraging momentum signals and well-defined rules, the strategy enforces discipline and enhances execution reliability.
Backtest results show outstanding performance on assets like SUI and TRX, with peak cumulative returns exceeding 150% and well-contained drawdowns. Although the win rate generally remained below 50%, the asymmetric payoff profile and strict stop-loss design enabled steady profitability, highlighting the strategy’s resilience in volatile environments.
In summary, the MACD trend strategy achieves a well-rounded balance among return potential, drawdown resistance, and execution efficiency, making it viable for real-world deployment. With further integration of volume dynamics, trend strength indicators, or multi-timeframe confirmation, the strategy can continue improving its adaptability and scalability in complex market structures.
References:
- CoinGecko, https://www.coingecko.com/
- Gate, https://www.gate.com/trade/BTC_USDT
- Gate, https://www.gate.com/trade/ETH_USDT
- Coinglass, https://www.coinglass.com/LongShortRatio
- Coinglass, https://www.coinglass.com/BitcoinOpenInterest?utm_source=chatgpt.com
- Gate, https://www.gate.com/futures_market_info/BTC_USD/capital_rate_history
- Gate, https://www.gate.com/futures/introduction/funding-rate-history?from=USDT-M&contract=ETH_USDT
- Coinglass, https://www.coinglass.com/pro/futures/Liquidations
Gate Research is a comprehensive blockchain and cryptocurrency research platform that provides deep content for readers, including technical analysis, market insights, industry research, trend forecasting, and macroeconomic policy analysis.
Disclaimer
Investing in cryptocurrency markets involves high risk. Users are advised to conduct their own research and fully understand the nature of the assets and products before making any investment decisions. Gate is not responsible for any losses or damages arising from such decisions.
Share


Related Articles

Reflections on Ethereum Governance Following the 3074 Saga

Gate Research: 2024 Cryptocurrency Market Review and 2025 Trend Forecast

Perpetual Contract Funding Rate Arbitrage Strategy in 2025

Gate Research: BTC Breaks $100K Milestone, November Crypto Trading Volume Exceeds $10 Trillion For First Time

NFTs and Memecoins in Last vs Current Bull Markets
