Gate Research: BTC and ETH Consolidate at Highs, While ADA Bollinger Strategy Holds Steady Gains
Summary
- Both BTC and ETH are fluctuating within a high-level consolidation range. Their price structures and volatility patterns have diverged, indicating weak short-term momentum overall.
- The BTC long-short ratio continues to decline, while ETH’s ratio also drops during its upward movement, showing a divergence between sentiment and price structure.
- In the derivatives market, BTC’s open interest has retreated significantly from recent highs, whereas ETH’s positions remain relatively stable, suggesting that leveraged capital has not fully exited.
- On September 22, long liquidations surged past $1.6 billion, underscoring intensifying selling pressure at high levels and triggering panic stop-losses that further weakened sentiment.
- From a quantitative strategy perspective, a mean-reversion strategy based on Bollinger Bands performed impressively on the ADA token, with annualized returns exceeding 60%, demonstrating strong potential for short-term trading.
Market Overview
To systematically capture the evolving capital flows and trading structure in the cryptocurrency market, this report analyzes five key dimensions: price volatility of BTC and ETH, long-short taker size ratio (LSR), open interest, funding rates, and liquidation data. These metrics collectively reflect market trend strength, sentiment, and risk exposure, providing a comprehensive view of current trading intensity and structural patterns. Below is a breakdown of each metric’s latest trends since September 9:
1. Price Volatility Analysis of Bitcoin and Ethereum
According to CoinGecko, the market has remained in a high-level consolidation phase from September 9 to 22. After setting new local highs, both BTC and ETH entered a phase of reduced momentum and lower trading volumes, signaling growing market divergence.
- BTC has been struggling to break through the $119,000 resistance level since mid-August, having peaked at $124,400. After multiple failed attempts, it began to decline in mid-September, losing key support and exhibiting a weakening trend.
- ETH surged past $4,700 before retracing rapidly, reaching a low of $4,067 on September 21, confirming a short-term bearish structure【1】【2】【3】.
At the macro level, signals are mixed:
- The Solana ecosystem has gained support from multiple public companies, with TVL rising in liquid staking protocols like Jito.
- The Avalanche RWA sector saw a 30-day volume surge of 130%, indicating a revival in ecosystem activity.
- Perp DEX volumes are repeatedly hitting new highs, with protocols like Aster standing out.
In summary, both BTC and ETH showed weakness post mid-September, but ETH has stronger institutional demand and is supported by the ETF narrative. If ETH can reclaim $4,300 with increased volume, it may lead a recovery. In the short term, we recommend monitoring:
- ETF net inflows,
- Whether ETH stabilizes technically,
- And if the market shifts from consolidation to sectoral rotation.
Figure 1: BTC repeatedly failed to break above $119,000; ETH pulled back sharply after breaching $4,700, bottoming near $4,067.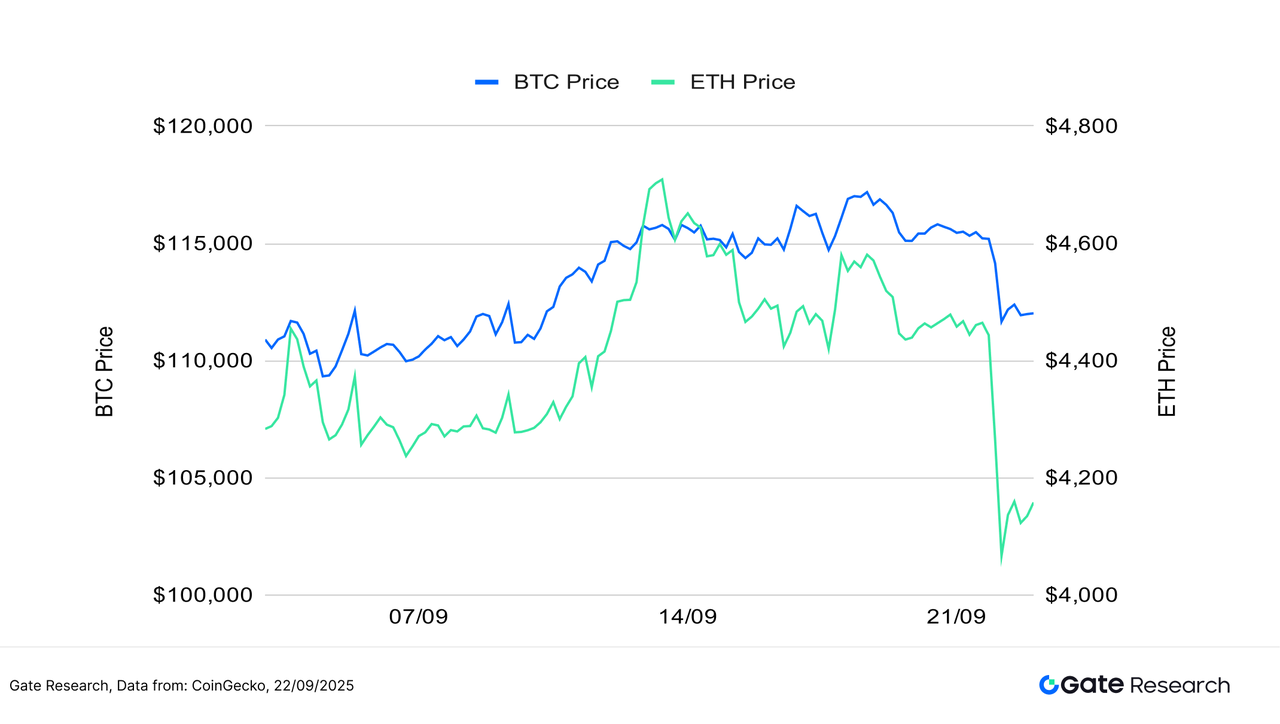
BTC’s volatility remained moderate, with only a few high-volatility days, suggesting a stable institutional rhythm and clear directional expectations. On the other hand, ETH exhibited significantly more volatility, with multiple spikes in the past two weeks, indicating more sensitive capital movements and emotional trading, especially near key levels.
Although volatility hasn’t surged across the board, ETH’s frequent spikes merit attention. If accompanied by volume expansion, it may signal the brewing of a new market phase. We suggest watching ETH’s volatility-volume interaction closely.
Figure 2: BTC volatility remained stable with few surges; ETH showed repeated spikes, reflecting rising short-term trading sentiment.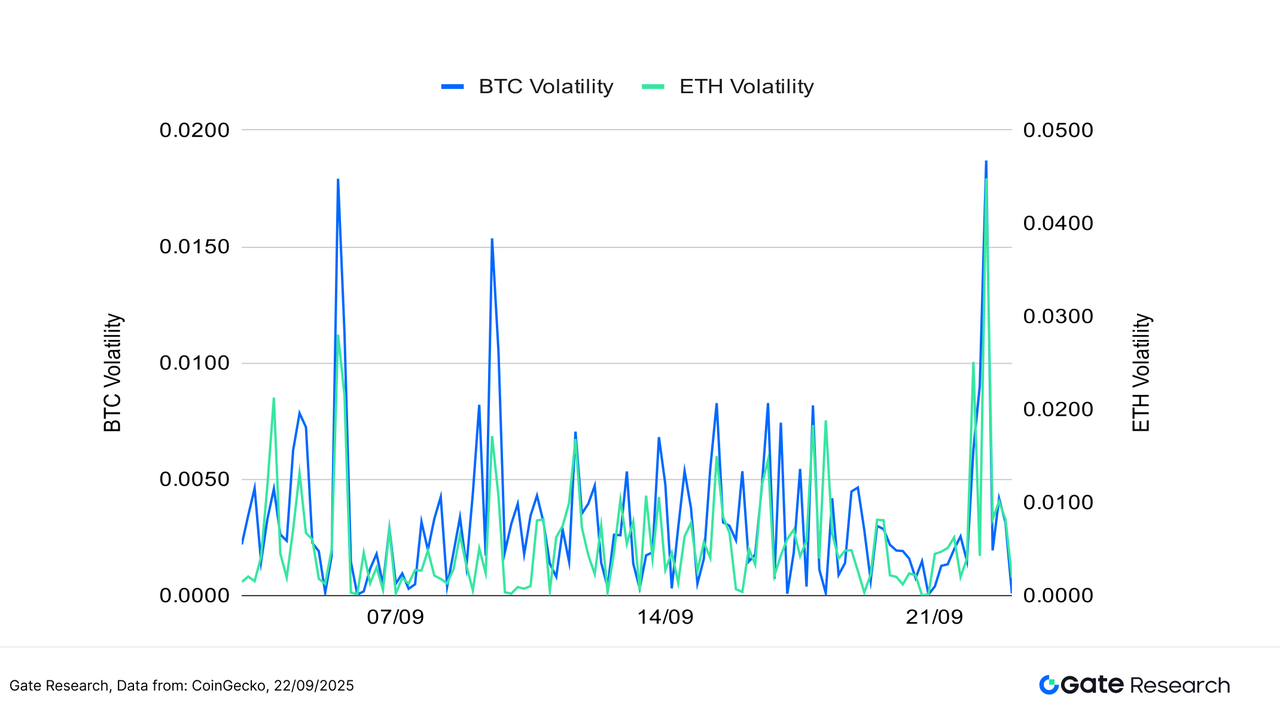
Currently, the market is in a high-level consolidation, with BTC showing structural stability but weak momentum. While ETH is technically weak short term, it has potential to rebound earlier due to ETF flows and rising volatility. We recommend watching capital movement and support levels for ETH to determine if a structural rotation is imminent.
2. Analysis of Long/Short Taker Size Ratio (LSR) for Bitcoin and Ethereum
The Long/Short Taker Size Ratio (LSR) is a key indicator that measures the volume of aggressive buying versus aggressive selling, often used to gauge market sentiment and trend strength. An LSR greater than 1 indicates that the volume of market buys (aggressive longs) exceeds that of market sells (aggressive shorts), suggesting a bullish market bias.
According to Coinglass data, over the past two weeks, despite BTC staying in a high consolidation zone, LSR declined steadily and fell below 0.9, indicating diminished appetite for chasing long positions. Though BTC held its structural support, sentiment weakened, and lack of new buyers made the trend unsustainable【5】.
ETH saw a similar trend, with its LSR falling below BTC’s despite its early September rally above $4,300. ETH’s LSR hovered near 0.9, showing that its price rally lacked synchronized emotional and capital support—a clear sentiment-price divergence.
In conclusion, both BTC and ETH exhibited weak LSRs during this period, reflecting diminished short-term momentum. Unless LSRs rebound above 1, the probability of sustained upside remains limited. Conversely, a sharp recovery in LSR may be a key signal for market reversal.
Figure 3: BTC remained range-bound but LSR declined steadily, showing fading long interest.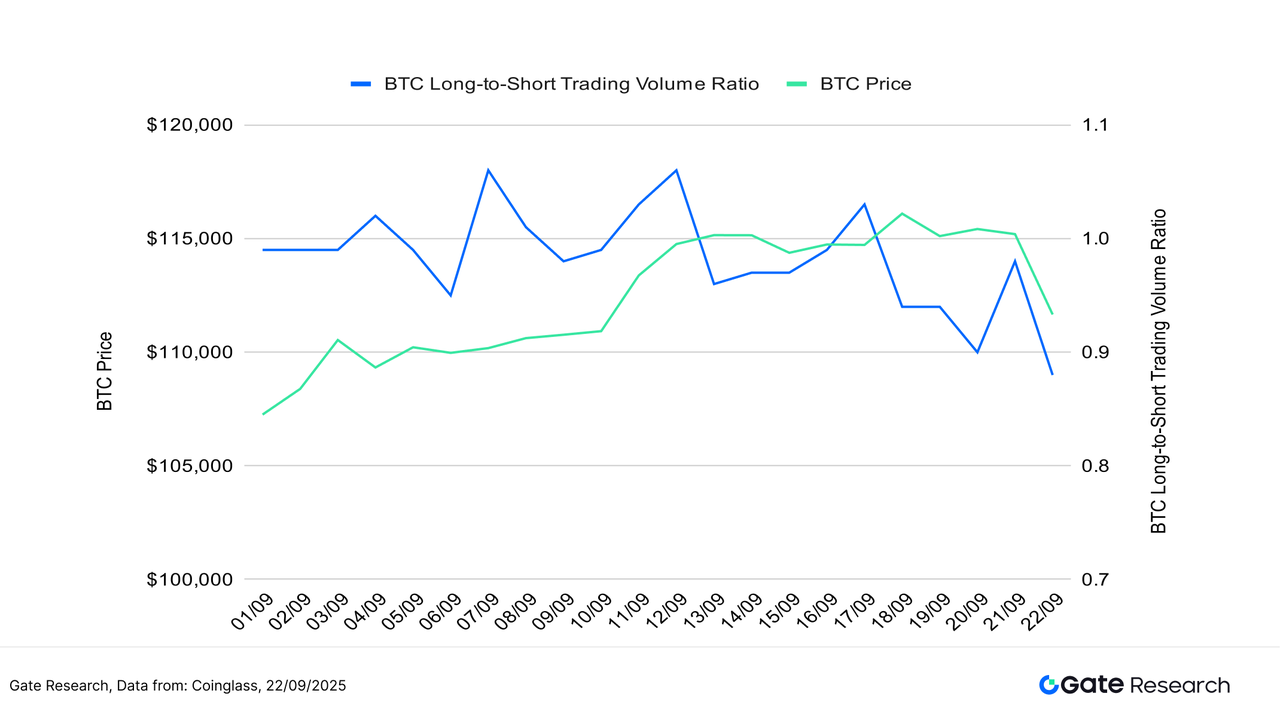
Figure 4: ETH’s LSR dropped even more sharply, with sentiment diverging from the price rally.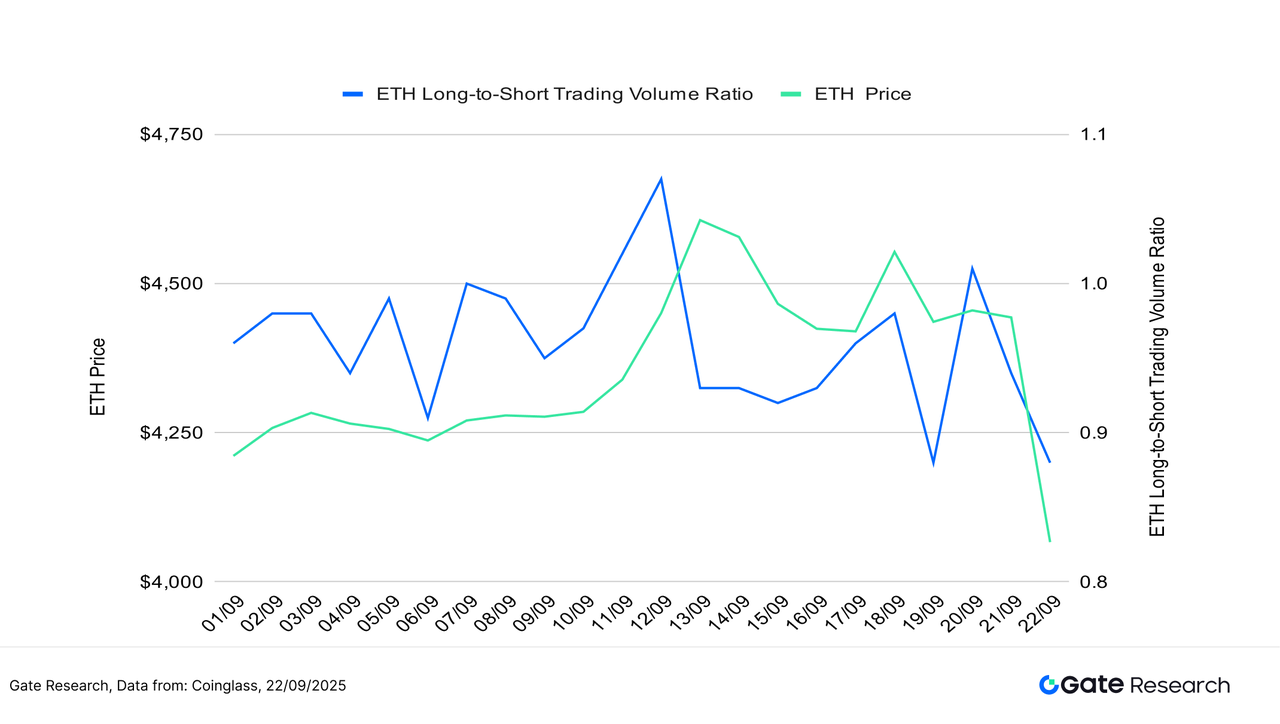
3. Open Interest Analysis
Coinglass data shows that BTC and ETH open interest levels remain relatively high, suggesting that leverage-driven speculation is still active【6】.
- BTC open interest rose rapidly to $86B in early September, but then fell sharply, indicating deleveraging by bullish traders, likely as a risk-averse move amid weaker sentiment.
- ETH, in contrast, maintained a more stable open interest curve. Although there were fluctuations, the decline was less severe, implying more stable conviction among leveraged ETH traders.
Overall, BTC long positions are cooling off, while ETH shows stronger resilience in leveraged positioning. However, both remain in price and leverage-heavy zones, and if volatility increases further, the risk of chain-reaction liquidations or irrational pullbacks may rise.
Figure 5: BTC open interest fell sharply from the highs; ETH remained relatively stable, with leveraged capital not fully withdrawn.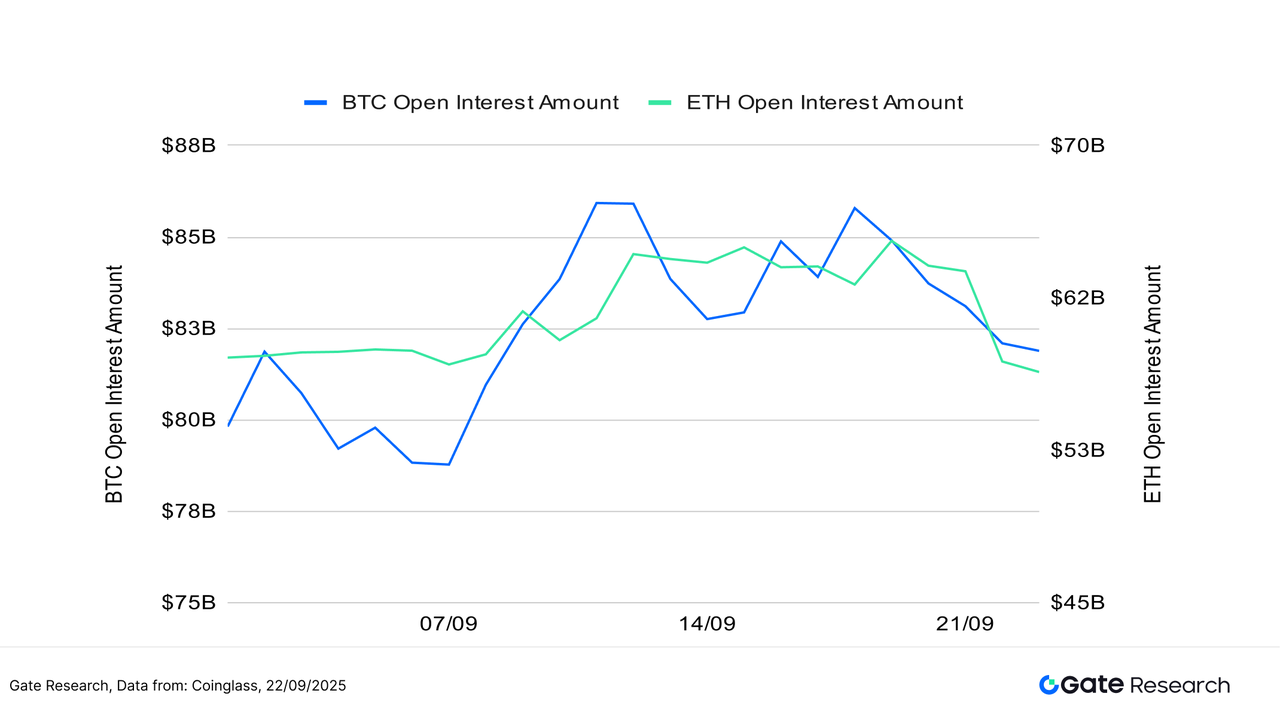
4. Funding Rate
For most of the observed period, the funding rates for both BTC and ETH remained in positive territory, only briefly turning negative during isolated timeframes. This indicates a mildly bullish market structure, where long positions dominate and leverage has not significantly retreated, though market sentiment is not overly optimistic【7】【8】.
- During ETH’s pullbacks—particularly around mid-month and at month-end—funding rates turned negative more noticeably, reflecting a temporary shift toward caution. However, these dips were short-lived and quickly recovered, avoiding systemic sell-offs.
- In contrast, BTC’s funding rates remained more stable, consistently hovering above zero with smaller fluctuations, indicating stronger institutional and long-term investor confidence.
In summary, current funding rates suggest a modestly bullish bias, but lack explosive momentum. If funding rates continue to rise in tandem with growing trading volumes, it could signal the potential for an extended rally. Conversely, if rates turn persistently negative, that may indicate a short-term trend reversal risk.
Figure 6: BTC and ETH funding rates mostly stayed positive, reflecting a bullish tilt—but long-side momentum remains moderate.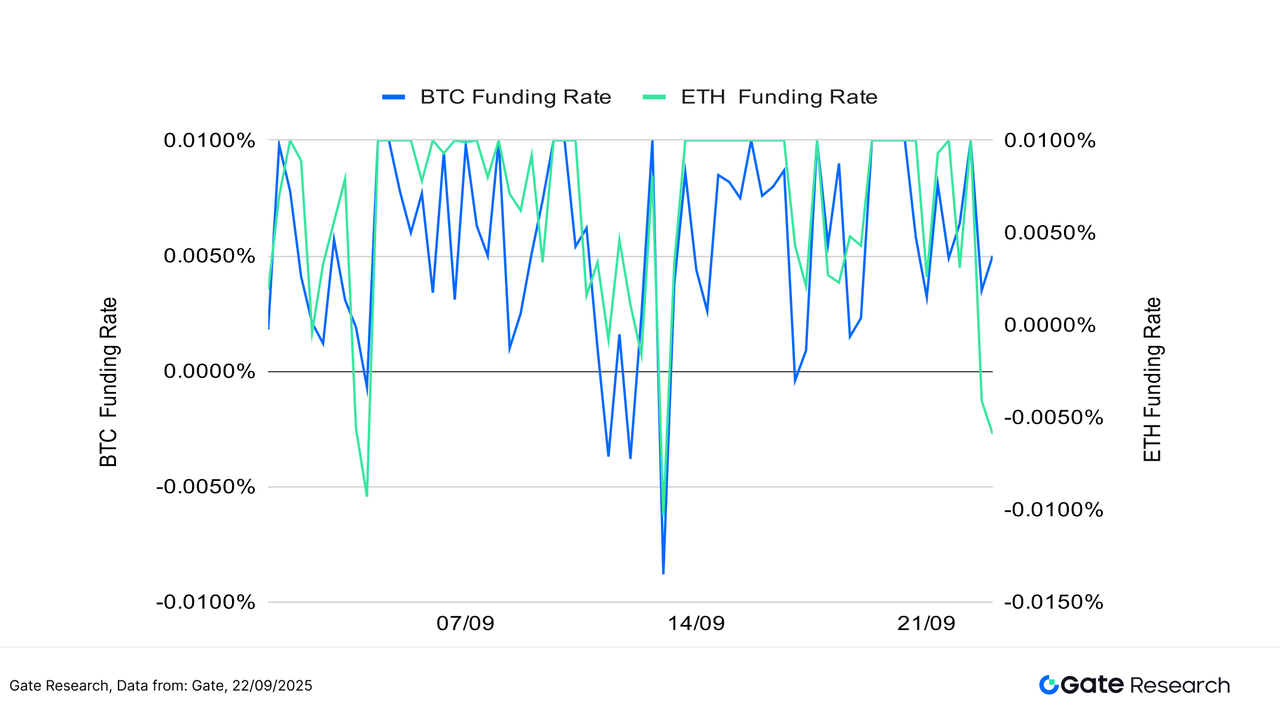
5. Cryptocurrency Liquidation Chart
According to Coinglass, despite overall market consolidation at high levels, periodic price swings have triggered a series of liquidations, indicating ongoing tension between long and short positions【9】.
- Most liquidations have been relatively moderate, displaying a healthy rotation between long and short side pressure. For instance:
- September 12 and 13 saw spikes in short liquidations, as prices briefly rebounded and forced short sellers to exit.
- On September 15 and 19, long positions dominated liquidations, aligning with pullbacks during those days.
The largest single-day liquidation event occurred on September 22, when long liquidations surged past $1.6 billion, significantly above the average. This suggests that after breaking a key support level, the market saw a cascade of long liquidations, reflecting panic-driven exits and a sharp shift in short-term sentiment.
Overall, liquidation patterns still appear to be cyclical and rotational rather than systemically cascading. However, the large-scale long liquidations highlight rising pressure on leveraged positions. If the market fails to stabilize quickly, further deterioration in investor confidence could follow.
Figure 7: On September 22, long liquidations spiked above $1.6 billion, showing increased stress on the market and panic selling by over-leveraged bulls.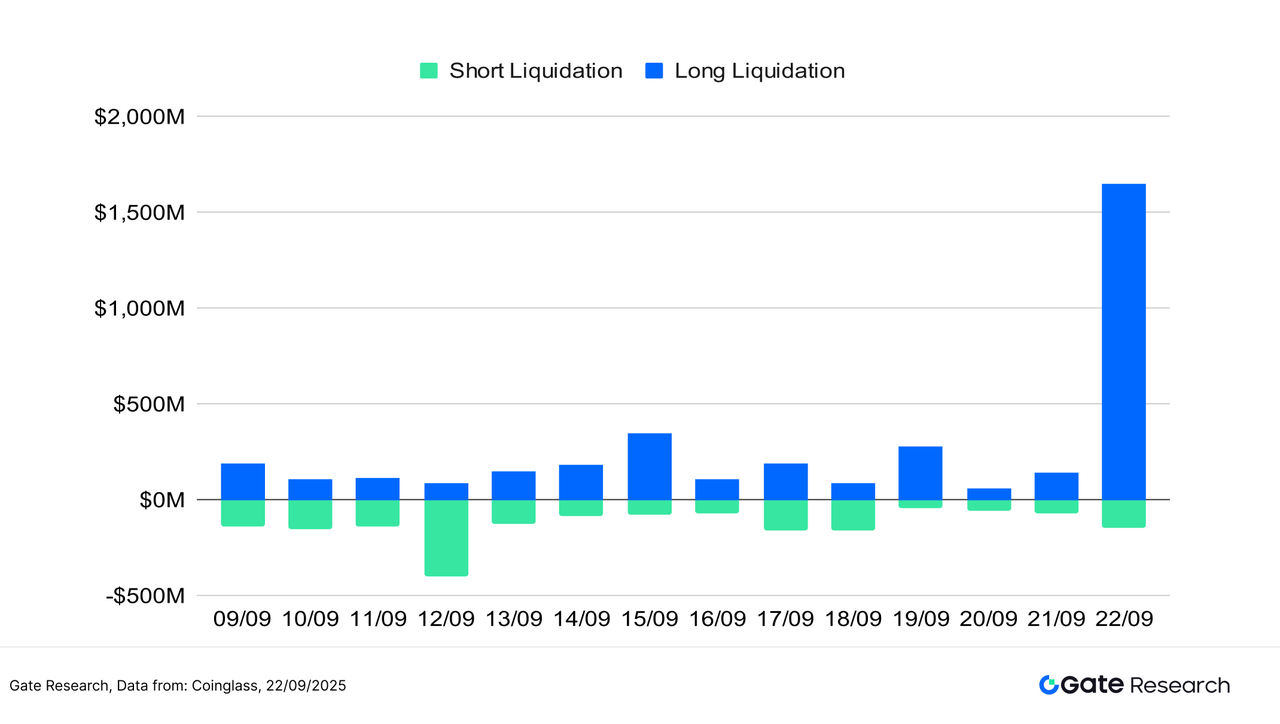
Amid the current high-level consolidation and compressed volatility, the crypto market remains mildly bullish, but various derivatives indicators point to fading long conviction and weakening short-term momentum:
- The LSR continues to trend downward,
- Funding rates remain positive but lack upside breakout signals, and
- The liquidation structure has shifted from balanced rotations to concentrated long-side collapses.
This suggests that market structure has not broken down, but confidence among leveraged traders is weakening.
Facing marginal leverage contraction and diverging long-short sentiment, investors should closely monitor key price zones and volatility indicators to determine whether the market is transitioning from consolidation to either a trend reversal or a corrective rebound.
Quantitative Analysis – Bollinger Band Reversion Strategy
(Disclaimer: All forecasts in this article are based on historical data and market trends and are for informational purposes only. They should not be considered investment advice or a guarantee of future market performance. Investors should carefully assess risks and make prudent decisions when engaging in related investments.)
1. Strategy Overview
The Bollinger Band Reversion Strategy is a mean-reversion trading approach that combines volatility signals with trend structure analysis. At its core, the strategy uses Bollinger Bands to identify potential short-term overextensions in price.
- When the price drops below the lower Bollinger Band, it is interpreted as a sign of short-term oversold conditions, triggering a long entry.
- Conversely, when the price crosses above the upper Bollinger Band or reaches pre-set take-profit or stop-loss thresholds, the strategy exits the position, assuming the trend phase has ended.
To enhance stability and decision-making accuracy, the system also incorporates multiple Simple Moving Averages (SMA) and Exponential Moving Averages (EMA) to track the broader trend. It applies fixed-percentage take-profit and stop-loss rules to manage risk and lock in profits.
This strategy is particularly well-suited for range-bound or high-volatility environments, aiming to capture short-term price reversals. It offers a degree of error tolerance and enforces disciplined trade execution.
2. Core Parameter Settings

3. Strategy Logic and Operational Mechanism
Entry Conditions
- When there is no open position, and the price breaks below the lower Bollinger Band, it is considered oversold, and a long position is opened.
Exit Conditions
- Stop-loss exit: If the price falls to entry price × (1 - stop_loss_percent), a stop-loss is triggered.
- Take-profit exit: If the price rises to entry price × (1 + take_profit_percent), a take-profit exit is executed.
- Upper Bollinger Band exit: If the price crosses above the upper Bollinger Band, it signals a return to mean or range, triggering an exit signal.
Practical Example Chart
- Trading Signal Triggered
The following chart illustrates the ETH/USDT 1-hour candlestick chart on May 25, 2025, when the strategy triggered a long entry. At that moment, the price broke below the lower Bollinger Band and quickly rebounded, accompanied by increased volume and a MACD bullish crossover. The strategy entered at this point, successfully capturing the start of a short-term rebound, consistent with its entry logic.
Figure 8: Entry point illustration for the ETH/USDT Bollinger Band Reversion Strategy (May 25, 2025)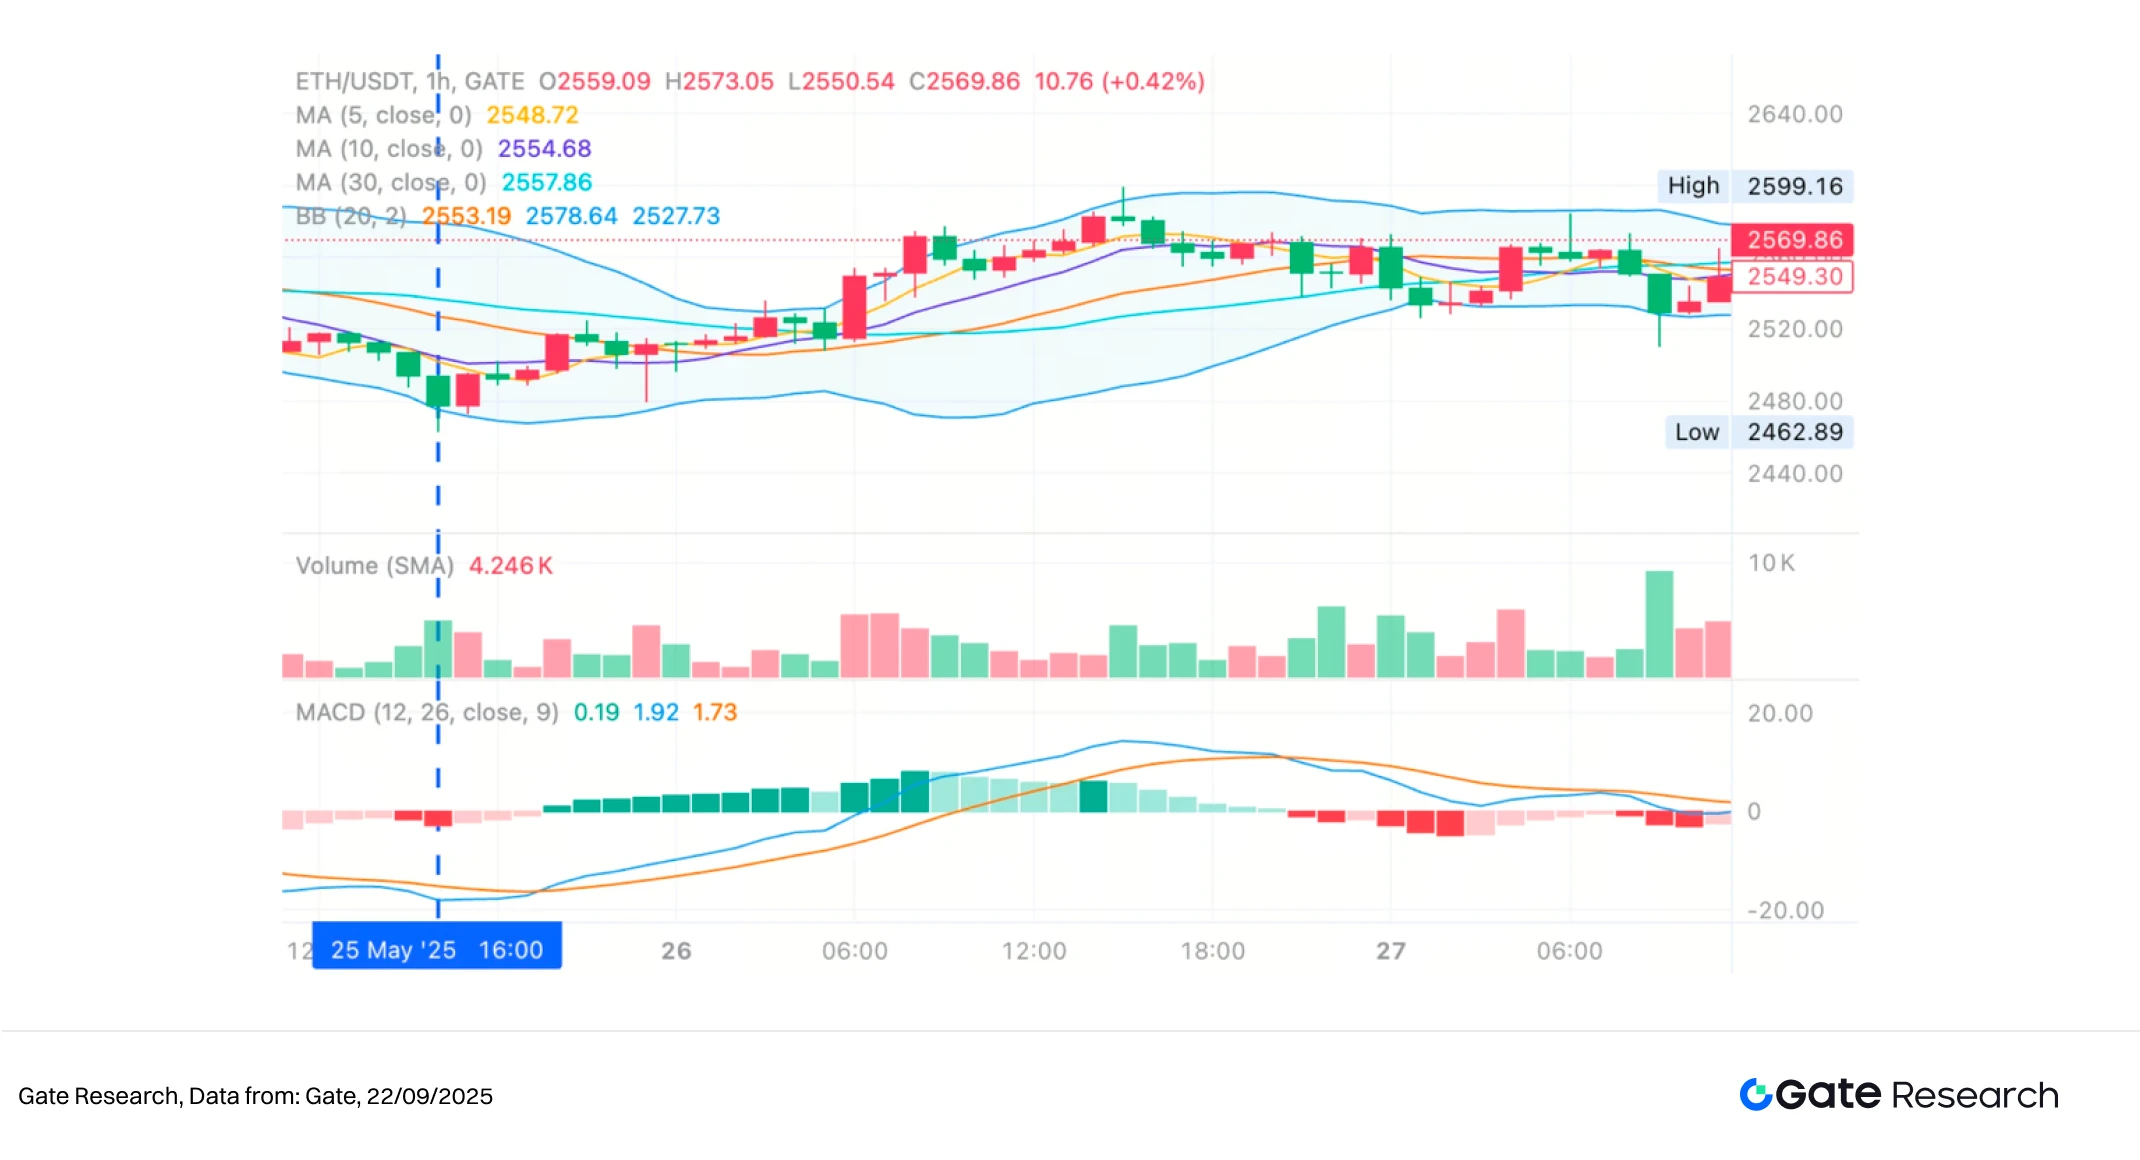
- Trading Action and Outcome
On May 26, after ETH touched the upper Bollinger Band, the system executed an exit based on the preset strategy logic, successfully locking in the short-term rebound profit. Although ETH continued to rise slightly afterward, this exit adhered to the disciplined exit criteria of the Bollinger strategy, demonstrating robust risk control execution. Incorporating trailing stop mechanisms or trend-following filters in the future may enhance performance in strong uptrends.
Figure 9: Strategy exit point on ETH/USDT (May 26, 2025)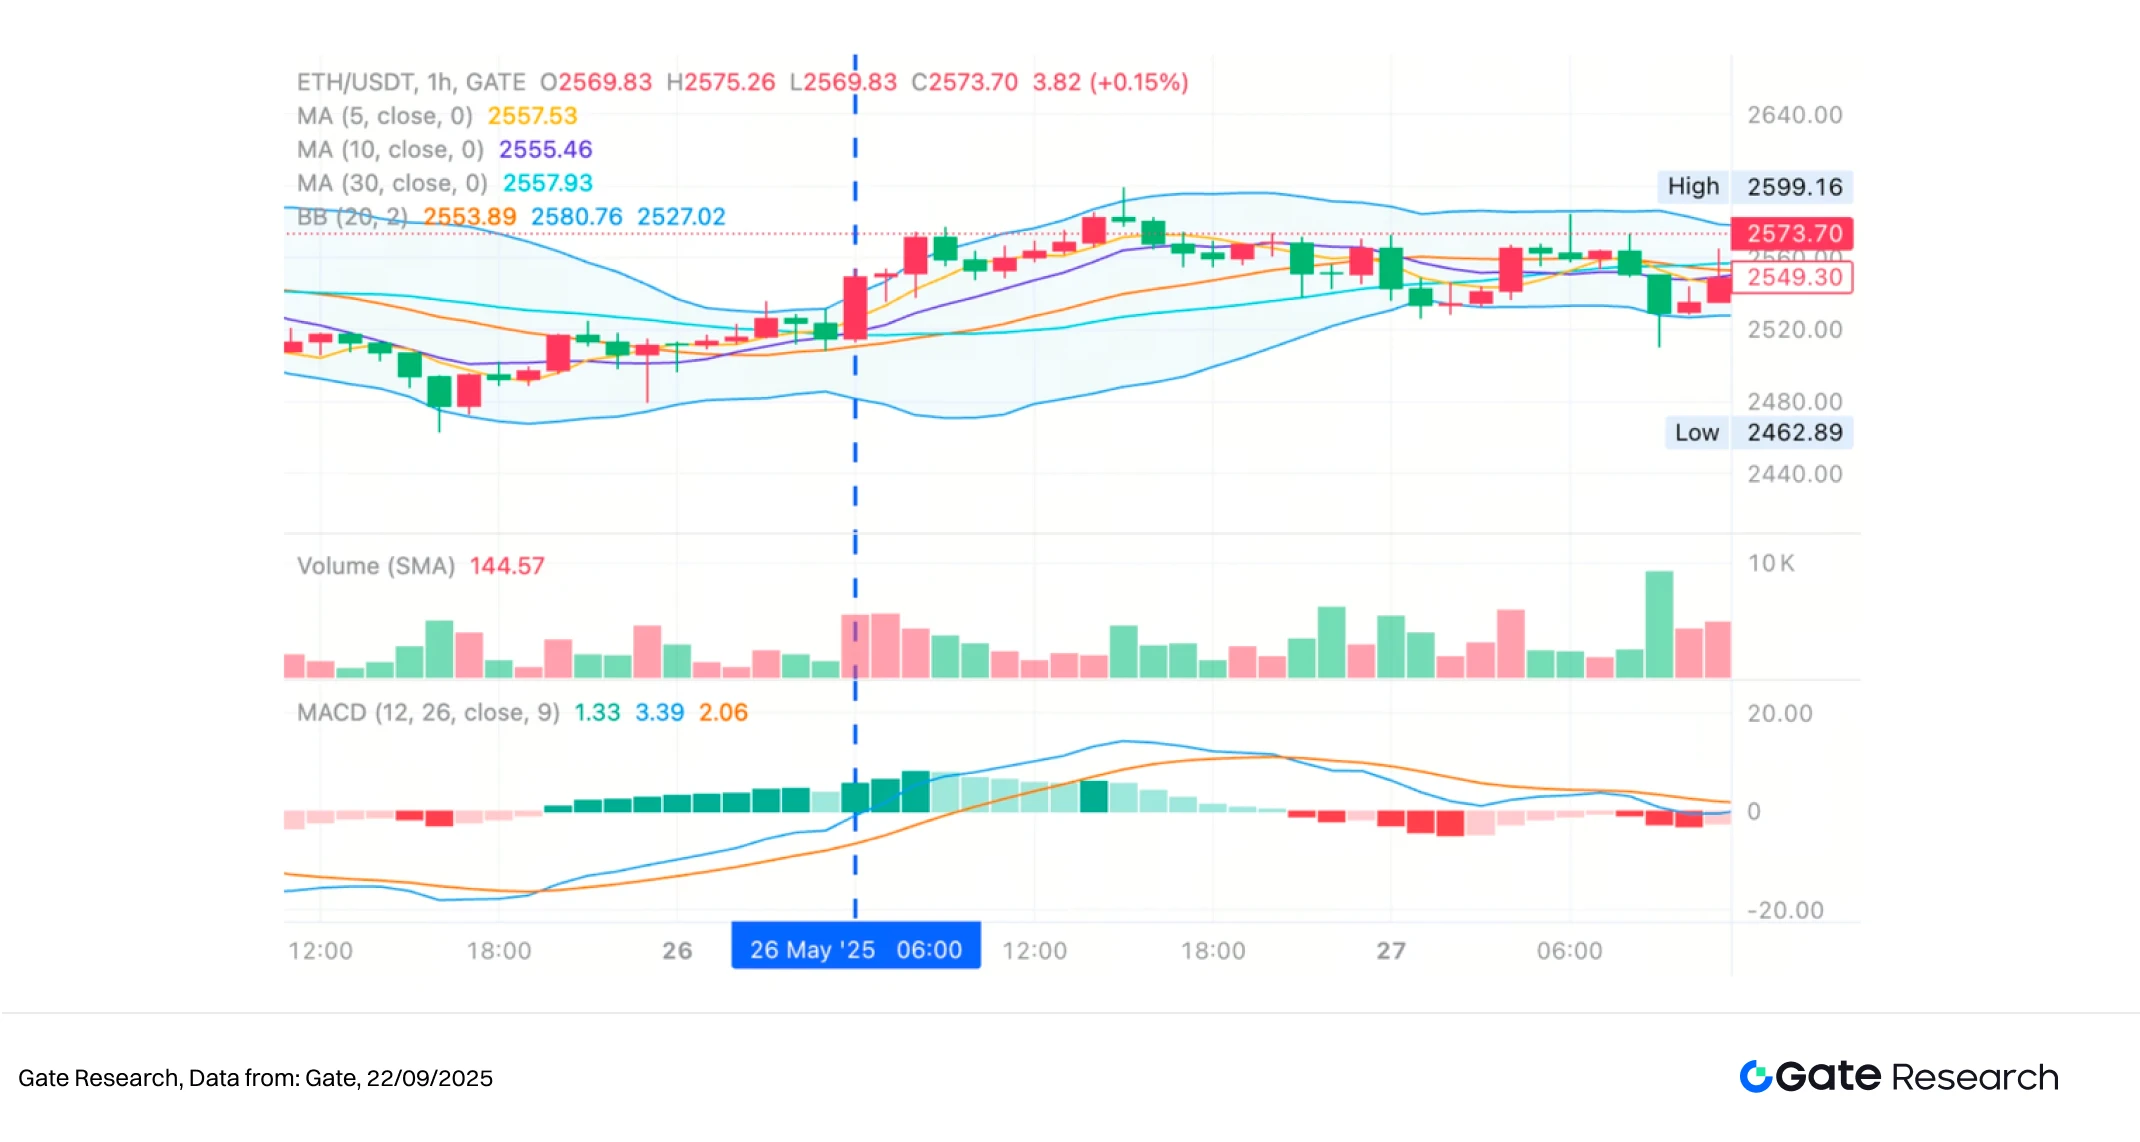
This live example clearly illustrates how the strategy enters trades upon lower band breaches and exits based on upper band breakouts or risk thresholds, combining mean-reversion logic with dynamic risk management. The trade captured a short-term rebound while limiting drawdowns—showcasing the practicality and discipline of the Bollinger Band approach in volatile environments, and offering empirical evidence for parameter optimization and broader deployment.
4. Practical Backtesting Example
Parameter Backtesting Setup
To identify optimal parameters, a systematic grid search was conducted across the following ranges:
bb_period:5 to 25 (step size: 1)bb_dev:1 to 5 (step size: 1)stop_loss_percent:1% to 2% (step size: 0.5%)take_profit_percent:10% to 16% (step size: 5%)
Taking ADA/USDT as an example, the system tested a total of 630 parameter combinations over the past year’s 1-hour candlestick data and selected the five combinations that yielded the highest cumulative returns. Evaluation criteria included annualized return, Sharpe ratio, maximum drawdown, and ROMAD (Return Over Maximum Drawdown) to comprehensively assess strategy performance.
Figure 10: Comparison table of the five best-performing strategy parameter sets.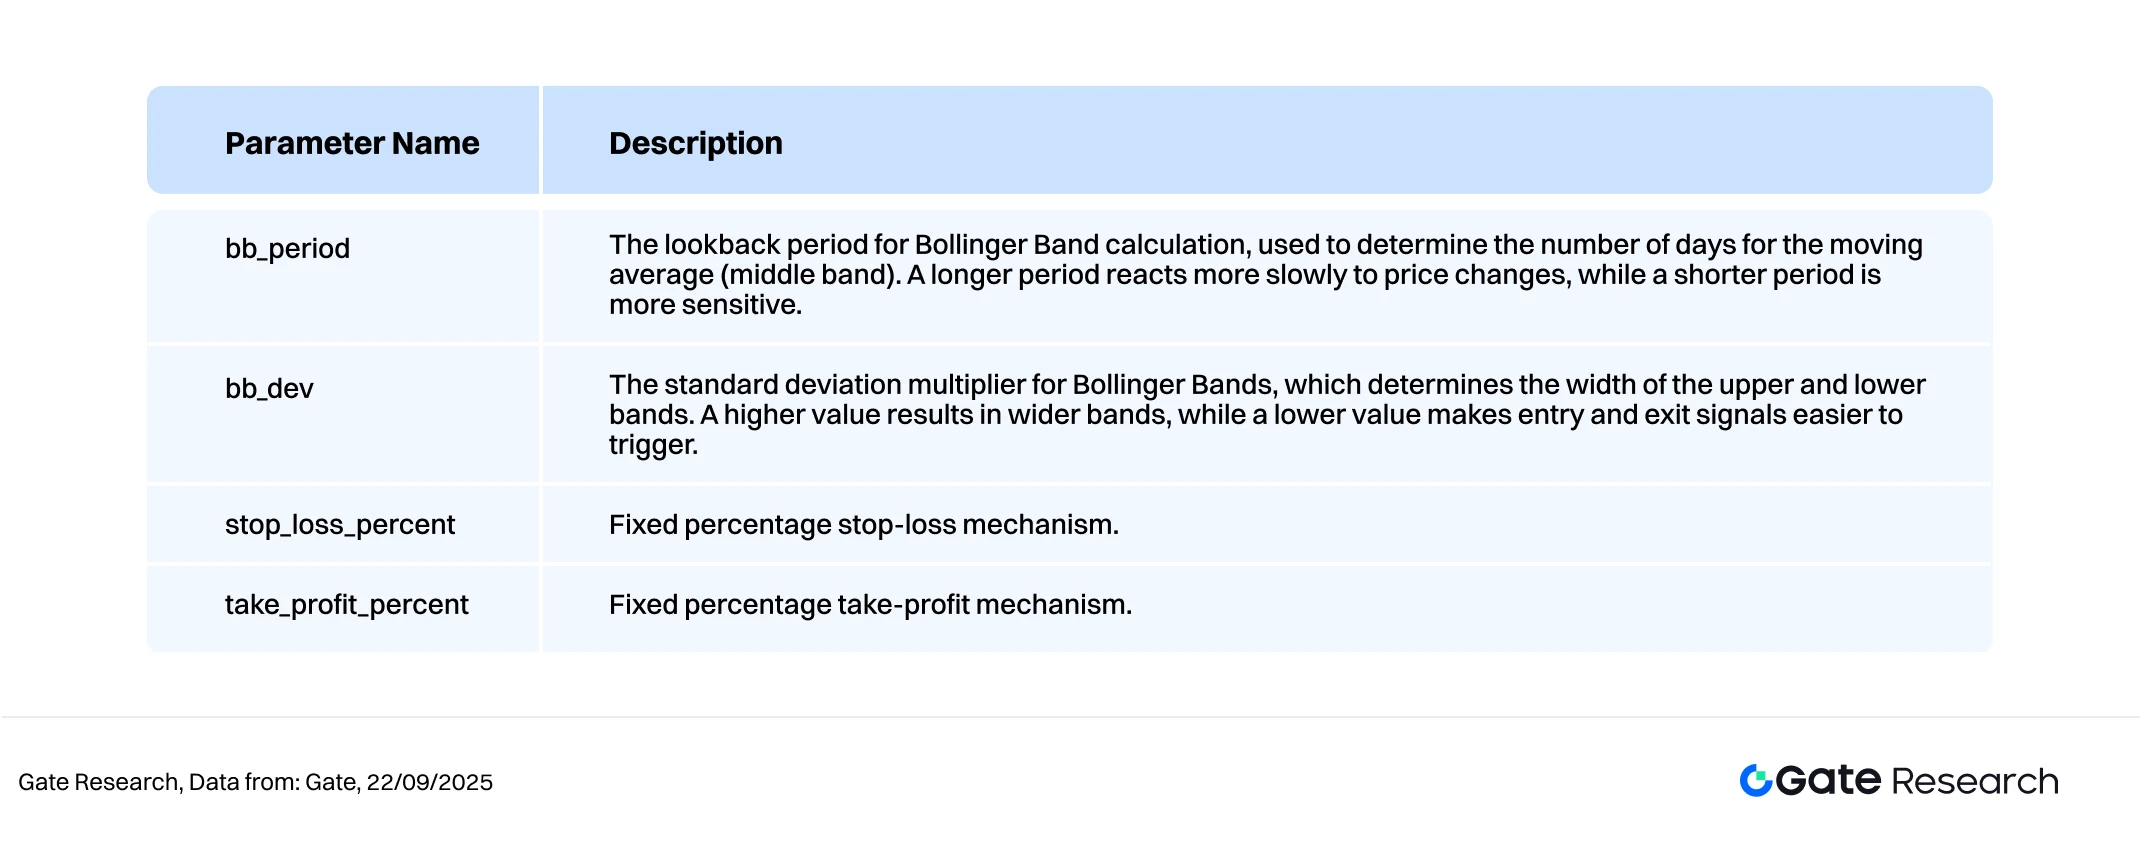
Strategy Logic Description
When the program detects a price drop below the lower Bollinger Band, it interprets this as a short-term oversold signal and immediately triggers a buy order. The strategy aims to capture mean-reversion rebounds, using the upper Bollinger Band as a dynamic take-profit reference. Exits are automatically triggered if price:
- Rebounds to the upper band, or
- Hits the preset stop-loss or take-profit thresholds.
The strategy is configured as follows:
bb_period= 17 (controls band responsiveness)bb_dev= 3 (sensitivity of band width)stop_loss_percent= 1%take_profit_percent= 15%
Performance and Results Analysis
The backtest covered January to September 2025, comparing the strategy across multiple tokens against a BTC buy-and-hold benchmark. Performance varied by asset, with some tokens showing significant alpha, ADA stood out with over 35% cumulative return from May to September. DOGE also performed well, steadily climbing over 15% return.
In contrast, ETH and TRX faced drawdowns mid-year—TRX dropped nearly -30%, showing increased risk in volatile or trend-driven phases. BTC Buy-and-Hold returned less than most Bollinger strategies, even after a July recovery. Strategies for SOL, APT, and SUI showed stable performance, minimizing losses in choppy markets, which highlights effective capital protection.
Figure 11: Comparison of cumulative returns of the top ten best-performing parameter sets over the past year.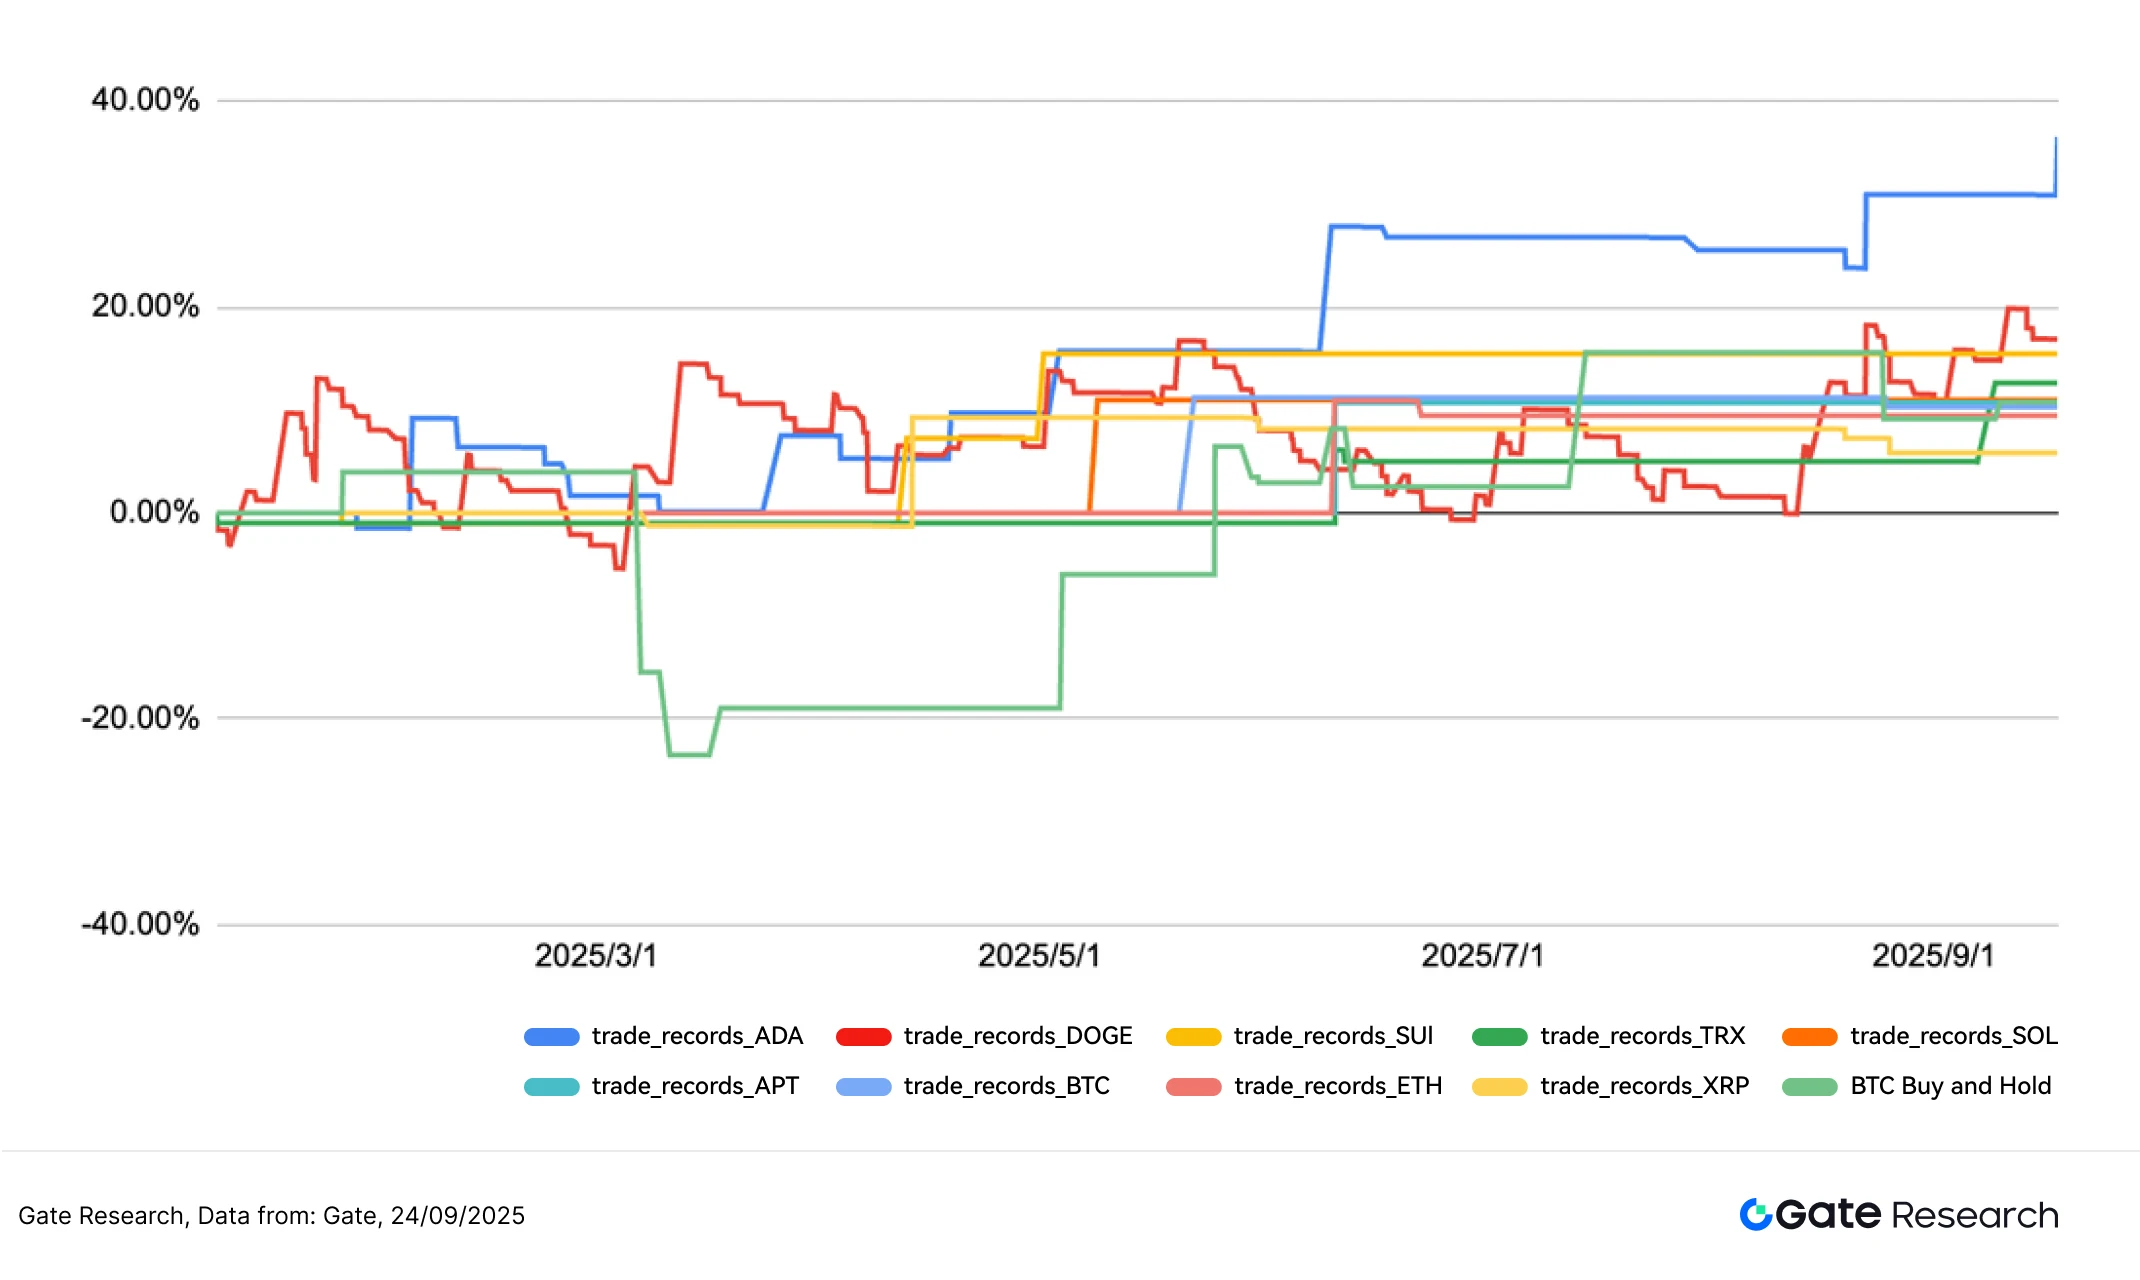
5. Strategy Summary
This research confirms the Bollinger Band Reversion Strategy has strong adaptability and practical potential in range-bound market conditions. By targeting mean-reversion opportunities, it outperformed buy-and-hold strategies across most tokens—particularly ADA and DOGE, which showed notable returns with good drawdown control.
Key highlights:
- Works best when price deviates briefly from the mean, then reverts quickly.
- Achieved 15–35% returns on standout assets like ADA and DOGE.
- Demonstrated robust discipline and resilience under volatile conditions.
However, the backtest also revealed limitations:
- In strong trends (e.g., ETH, TRX), the strategy may trigger premature reversals, leading to drawdowns.
- Thus, incorporating trend filters or momentum thresholds is critical for better accuracy.
In conclusion, this strategy strikes a preliminary balance between returns and risk, showing good adaptability across various market states. With further enhancements—like multi-timeframe logic, cross-asset deployment, and volatility-based triggers—it has the potential to become a robust quantitative tool.
Conclusion
From September 9 to 22, 2025, the crypto market remained in high-level consolidation, but capital flows and sentiment showed marginal shifts. Technically, BTC and ETH held support, but volatility and volume contracted, signaling slowing momentum. LSR, long-short ratios, and funding rates stayed positive—but lacked breakout strength, suggesting growing caution. ETH, despite ETF-related narratives, showed divergence between price and sentiment.
On the derivatives front, BTC’s open interest declined, while ETH stayed relatively stable but showed no significant inflows. Funding rates remained positive, but tepid. On September 22, long liquidations spiked over $1.6B, exposing leverage fragility and increasing market defensiveness.
Overall, the market appears to be in the late stage of consolidation, with sector rotation and position cleaning underway. While the trend may extend, weakened long-side conviction and lack of fresh capital inflows raise the risk of a downside break.
Amid this backdrop, the Bollinger Band reversion strategy proved effective. ADA delivered 35%+ returns, with the strategy showing good risk-reward balance in volatile conditions. However, low signal frequency and early reversals in trend-heavy markets (e.g., ETH, TRX) highlight the need for refinements. Future improvements—dynamic bandwidth, volatility filters, volume confirmation—could enhance signal quality and robustness, boosting the strategy’s value in live trading scenarios.
References:
- CoinGecko, https://www.coingecko.com/
- Gate, https://www.gate.com/trade/BTC_USDT
- Gate, https://www.gate.com/trade/ETH_USDT
- Sosovalue, https://sosovalue.com/assets/etf/us-btc-spot?from=moved
- Coinglass, https://www.coinglass.com/LongShortRatio
- Coinglass, https://www.coinglass.com/BitcoinOpenInterest?utm_source=chatgpt.com
- Gate, https://www.gate.com/futures_market_info/BTC_USD/capital_rate_history
- Gate, https://www.gate.com/futures/introduction/funding-rate-history?from=USDT-M&contract=ETH_USDT
- Coinglass, https://www.coinglass.com/pro/futures/Liquidations
Gate Research is a comprehensive blockchain and cryptocurrency research platform that provides deep content for readers, including technical analysis, market insights, industry research, trend forecasting, and macroeconomic policy analysis.
Disclaimer
Investing in cryptocurrency markets involves high risk. Users are advised to conduct their own research and fully understand the nature of the assets and products before making any investment decisions. Gate is not responsible for any losses or damages arising from such decisions.
Share


Related Articles

Reflections on Ethereum Governance Following the 3074 Saga

Gate Research: 2024 Cryptocurrency Market Review and 2025 Trend Forecast

Perpetual Contract Funding Rate Arbitrage Strategy in 2025

Gate Research: BTC Breaks $100K Milestone, November Crypto Trading Volume Exceeds $10 Trillion For First Time

NFTs and Memecoins in Last vs Current Bull Markets
