Gate Research: BTC and ETH Consolidate and Recover, RSI Strategy Captures Reversal Opportunities
Summary
- BTC and ETH continued to consolidate and recover, with notable divergence in price structures and volatility, while short-term momentum remains weak.
- Long-short ratios and funding rates stayed mildly bullish, but buying interest remains limited as market sentiment turns cautious.
- After a period of deleveraging, open interest has gradually rebounded, with ETH positions showing stronger resilience than BTC, suggesting leveraged capital has not fully exited.
- Liquidation levels remain moderate as long and short forces alternate, keeping overall market structure balanced, though highly leveraged traders are still under pressure.
- In quantitative strategies, short-term RSI strategies delivered strong returns, while the Gate Quantitative Fund continues to emphasize steady gains and robust risk control, maintaining its long-term advantage.
Market Overview
To systematically present the current capital behavior and structural changes in the cryptocurrency market, this report analyzes five key dimensions: Bitcoin and Ethereum price volatility, long-short ratio (LSR), open interest, funding rates, and liquidation data. These five indicators collectively reflect price trends, capital sentiment, and risk dynamics, providing a comprehensive overview of the market’s trading intensity and structural characteristics. The following sections analyze the latest developments in each metric since October 14:
1. Bitcoin and Ethereum Price Volatility Analysis
According to CoinGecko data, between October 14 and October 27, the cryptocurrency market maintained a sideways consolidation pattern. After reaching a new high of $126,000 on October 7, BTC entered a consolidation phase with noticeably weaker trading momentum and growing divergence in market structure. Both BTC and ETH exhibited range-bound rebounds.
BTC stabilized near $108,000 at the beginning of the month and gradually recovered, shifting its short-term focus above $113,000. ETH rebounded from $3,700 to around $4,000, showing a milder upward rhythm. Overall, both remain in mid-term consolidation phases, with rebounds primarily driven by short-term speculative capital rather than trend-based breakouts.【1】【2】【3】
At the macro and on-chain levels, mixed long and short factors persist. Traditional capital continues to strengthen its exposure to the Ethereum ecosystem — for instance, Cathie Wood invested in the Japanese Ethereum treasury company Quantum Solutions, reflecting sustained institutional interest. Meanwhile, total value locked (TVL) across DeFi protocols remained steady at approximately $220 billion, suggesting a balanced capital structure.
Notably, Gate Perp DEX’s cumulative trading volume has surpassed $1 billion, emerging as a standout player in decentralized derivatives thanks to its Gate Layer L2 network and advanced matching engine. Overall, BTC and ETH appear to be forming medium-term bottoms amid current volatility. If ETH can regain footing above $4,000 with expanding trading volume, it may take the lead in a renewed uptrend.
Figure 1: BTC’s short-term range has shifted upward to above $113,000, while ETH rebounded from around $3,700 to the $4,000 level, showing a relatively steady pace.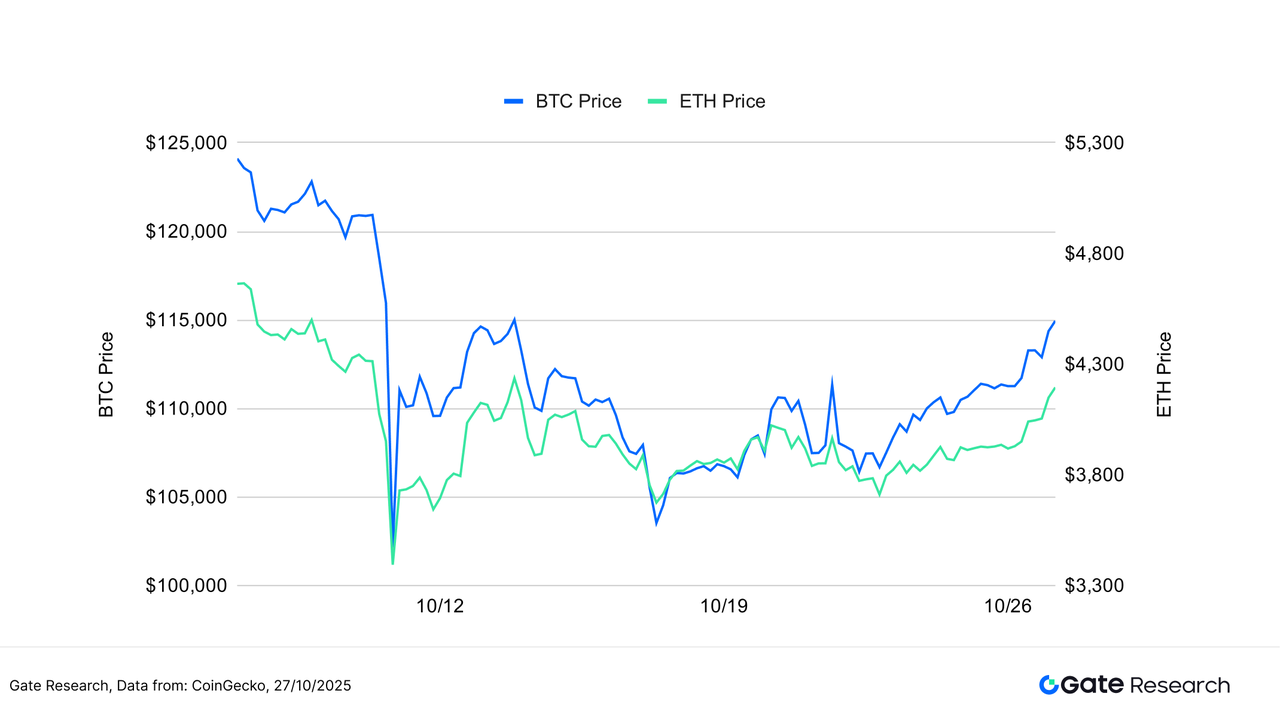
BTC volatility has remained subdued, with only brief spikes on select trading days, indicating that major capital flows are steady and directional expectations are relatively clear — suggesting limited appetite for aggressive buying or selling. In contrast, ETH has shown much higher volatility, with multiple sharp increases in recent weeks, signaling more frequent short-term capital inflows and heightened market sensitivity, especially around key price levels.
Overall, the market has yet to enter a phase of broad volatility expansion. However, ETH’s recurring volatility spikes warrant close attention. Should trading volume rise in tandem, it may signal the early stages of a new market cycle, making it crucial to monitor the interplay between ETH’s volatility and trading volume.
Figure 2: BTC maintains stable volatility with few high-volatility sessions, while ETH’s volatility repeatedly spikes, indicating rising short-term market sentiment.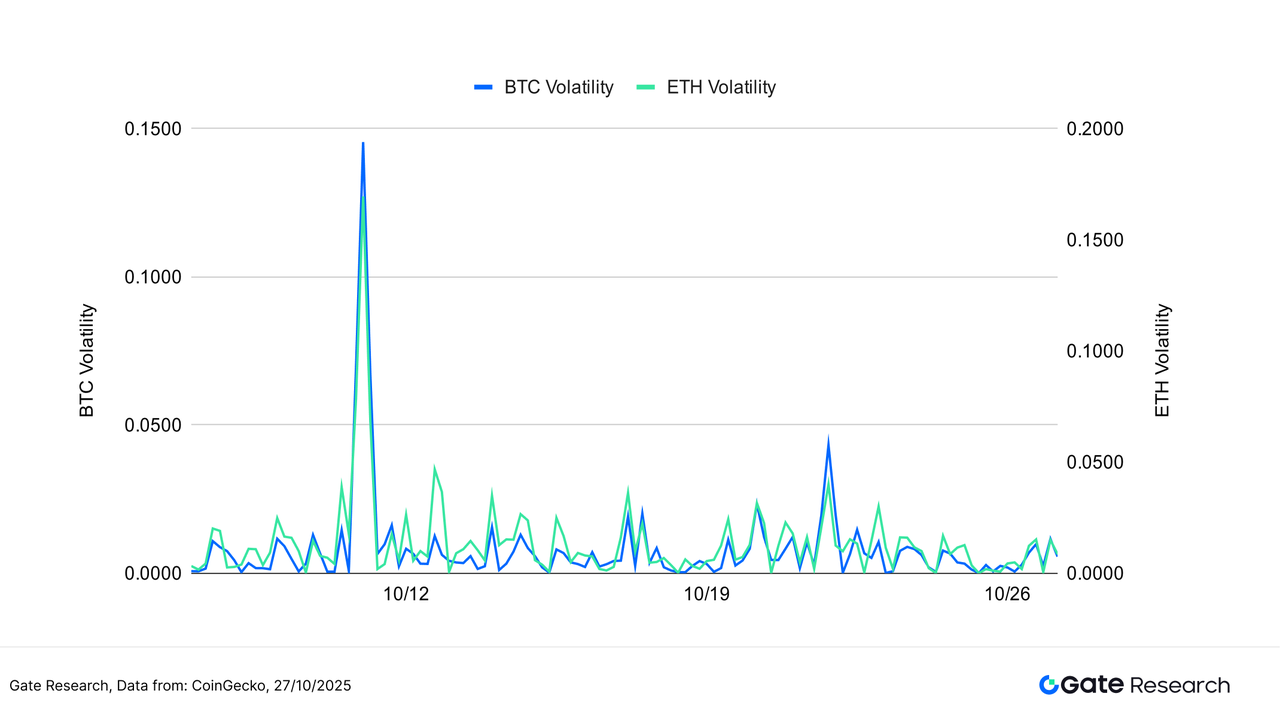
In summary, the cryptocurrency market remains in a phase characterized by low overall volatility and structural divergence. BTC demonstrates notable stability, with capital largely adopting a wait-and-see attitude, while ETH’s recurring volatility surges reveal that short-term traders are beginning to re-enter. If volume expansion continues alongside rising volatility, the market may soon face a decisive directional breakout.
2. Analysis of Long/Short Taker Size Ratio (LSR) for Bitcoin and Ethereum
The Long/Short Taker Size Ratio (LSR) is a key indicator that measures the volume of aggressive buying versus aggressive selling, often used to gauge market sentiment and trend strength. An LSR greater than 1 indicates that the volume of market buys (aggressive longs) exceeds that of market sells (aggressive shorts), suggesting a bullish market bias.
According to Coinglass data, the long-short ratio (LSR) for both BTC and ETH has fluctuated around 1, indicating a continuous tug-of-war in market sentiment amid consolidation, with no clear directional consensus among traders.【5】
BTC’s LSR briefly dipped below 0.9 in mid-October before rebounding above 1.1, suggesting that during the pullback phase, buying appetite was subdued. However, as prices stabilized and volatility narrowed, active buying gradually resumed, reflecting a cautiously bullish shift in market sentiment.
ETH’s LSR showed wider fluctuations, falling below 0.9 multiple times — a sign of more sensitive short-term trader sentiment. Toward the end of the month, however, ETH’s LSR also climbed rapidly to around 1.1, indicating a structural shift from caution to optimism, with long positions becoming increasingly dominant.
Overall, after mid-month weakness, the recovery of the long-short ratio suggests that bearish sentiment has eased and buying activity is returning. If the LSR can remain steadily above 1 alongside increasing trading volume, it could serve as a key signal for a sustained market rebound.
Figure 3: BTC’s long-short ratio has rebounded above 1, showing gradual recovery in buying sentiment.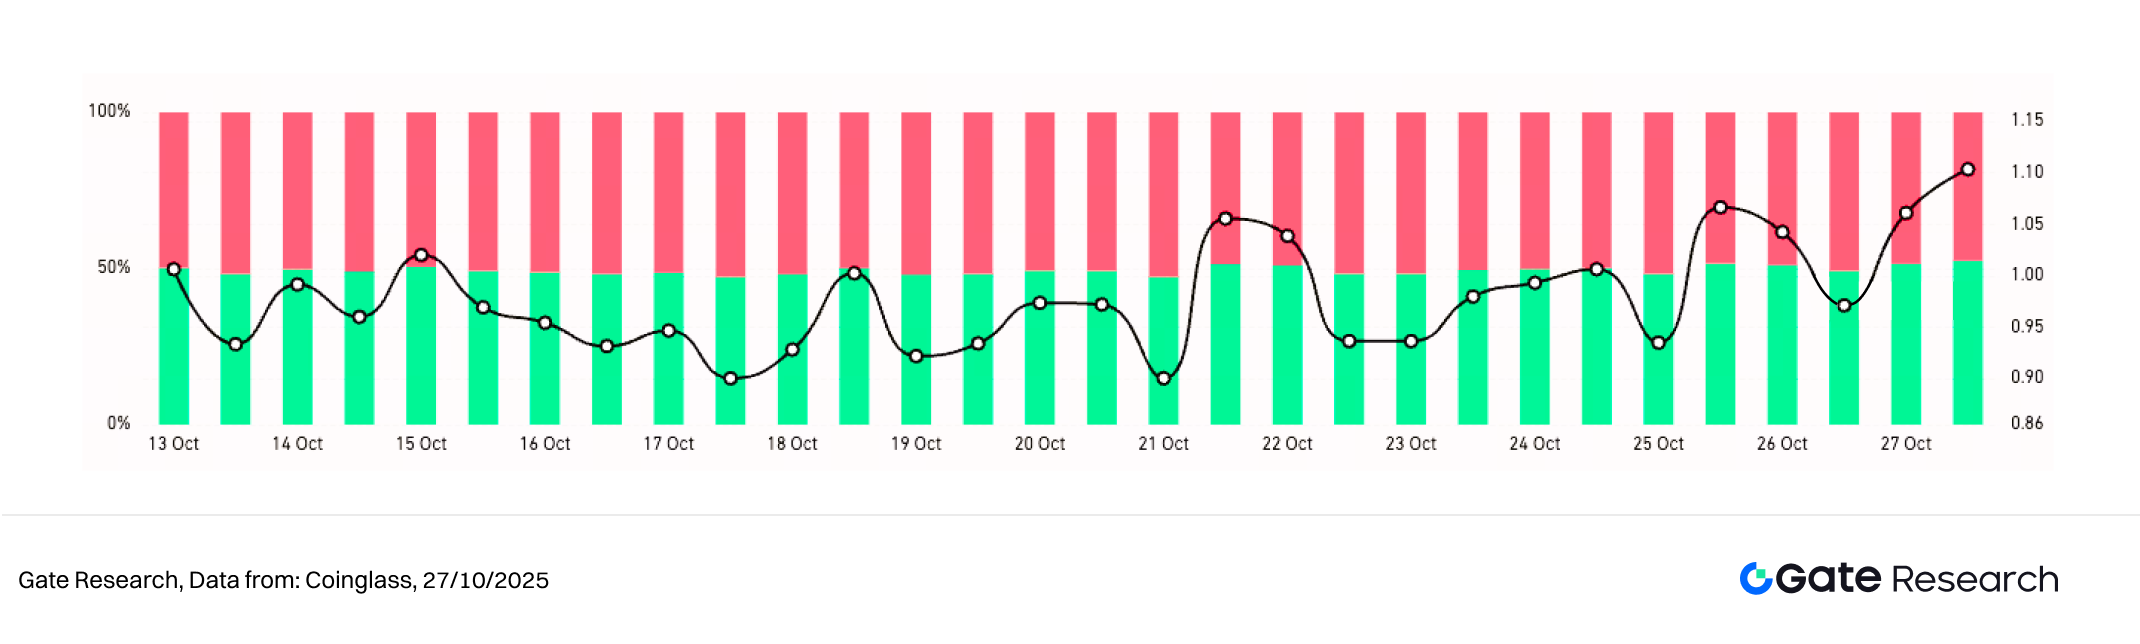
Figure 4: ETH’s long-short ratio fluctuates more sharply, with late-month capital positioning shifting from caution to a bullish bias.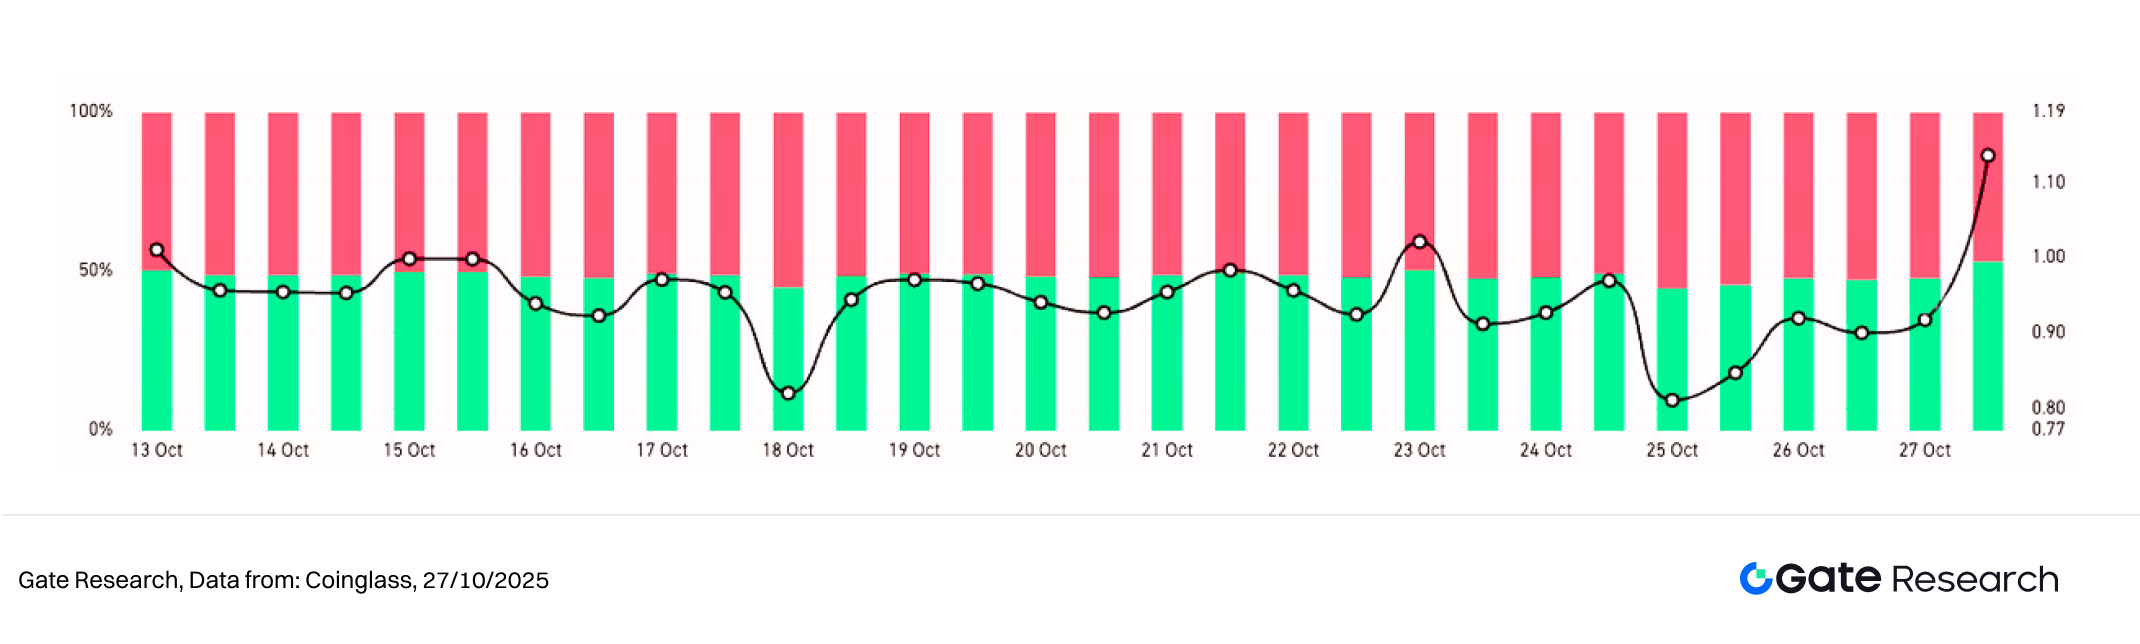
3. Open Interest Analysis
According to Coinglass data, over the past two weeks, BTC and ETH open interest has gradually recovered following a sharp decline earlier in the month, showing a “deleveraging followed by re-leveraging” pattern in market structure. The earlier drop reflected widespread liquidation of high-leverage long positions and a shift toward risk aversion, while the subsequent steady rebound indicates improving sentiment and renewed capital inflows.【6】
BTC’s open interest has remained within a relatively high range, with long positions rebuilding as prices stabilized — suggesting that institutions and major traders maintain a cautiously bullish outlook. ETH’s open interest recovery has been smoother and faster, implying stronger medium-term confidence among leveraged participants.
Overall, the current leverage structure has transitioned from overheating to a phase of healthy recovery. Capital is flowing back into the market, though not yet in full-scale leverage expansion. If prices continue to rise alongside growing trading volume, open interest may further increase; however, if the market comes under renewed pressure, tightening liquidity could trigger a short-term pullback.
Figure 5: BTC open interest remains at a high level, with long positions rebuilding after price stabilization.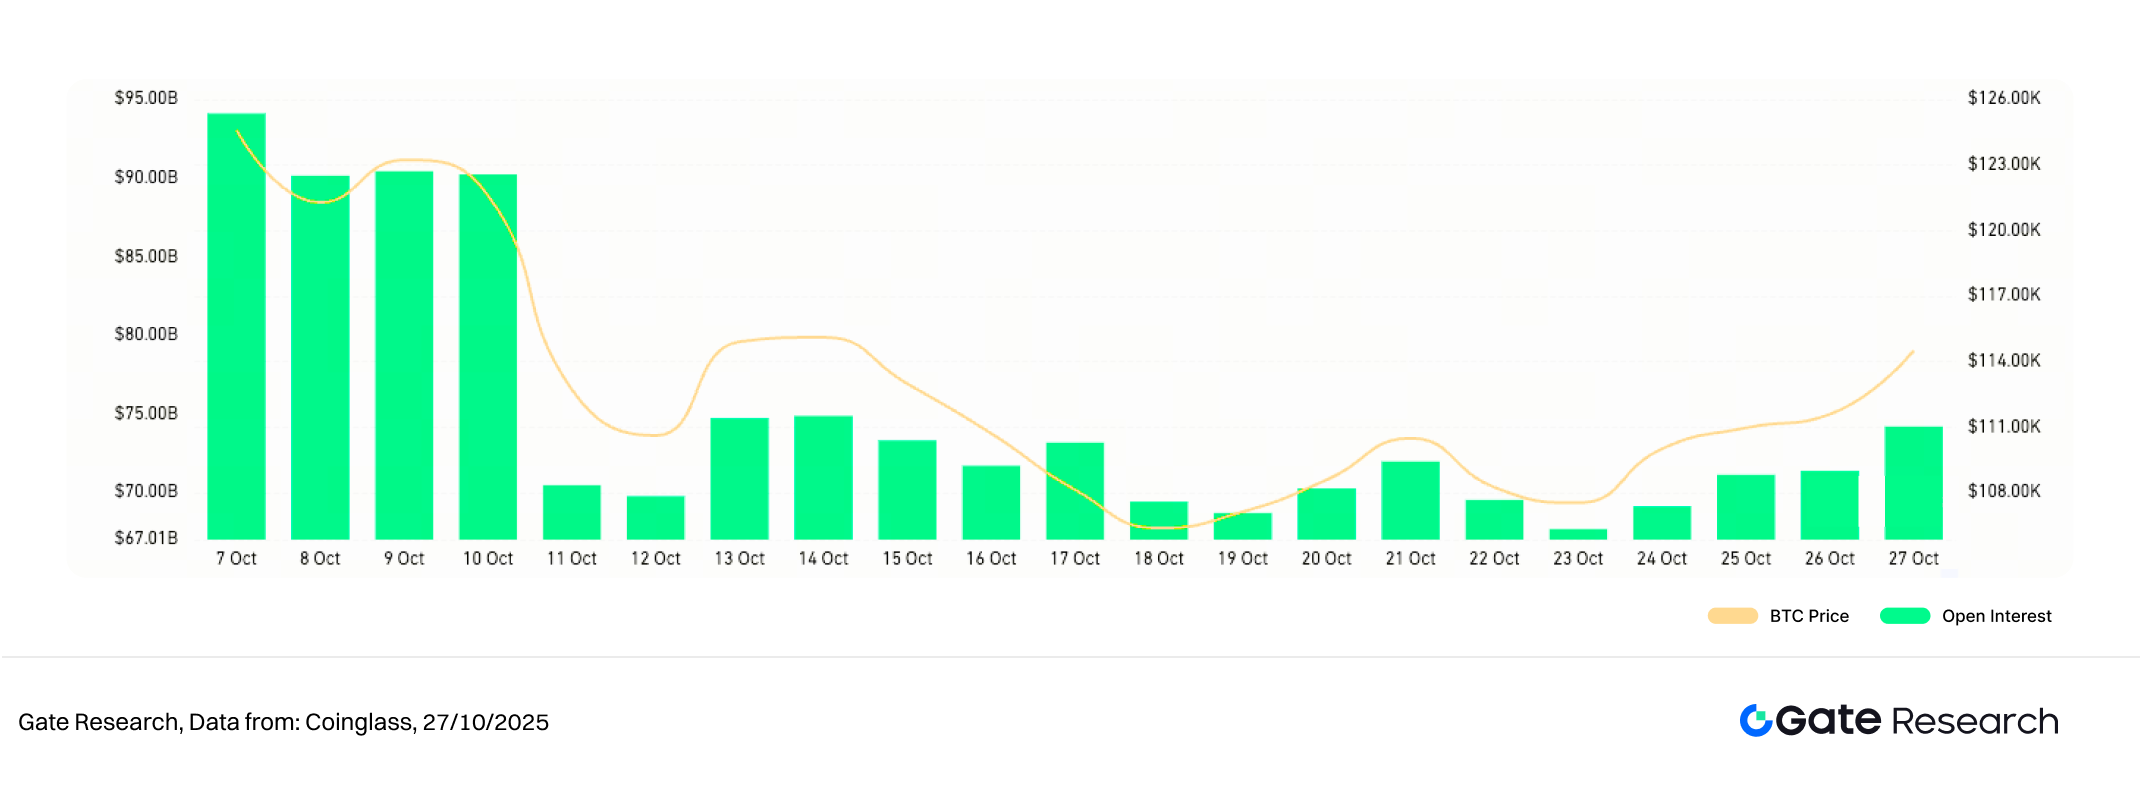
Figure 6: ETH open interest shows a steadier recovery, with faster leveraged capital inflows — indicating firmer market confidence in its medium-term outlook.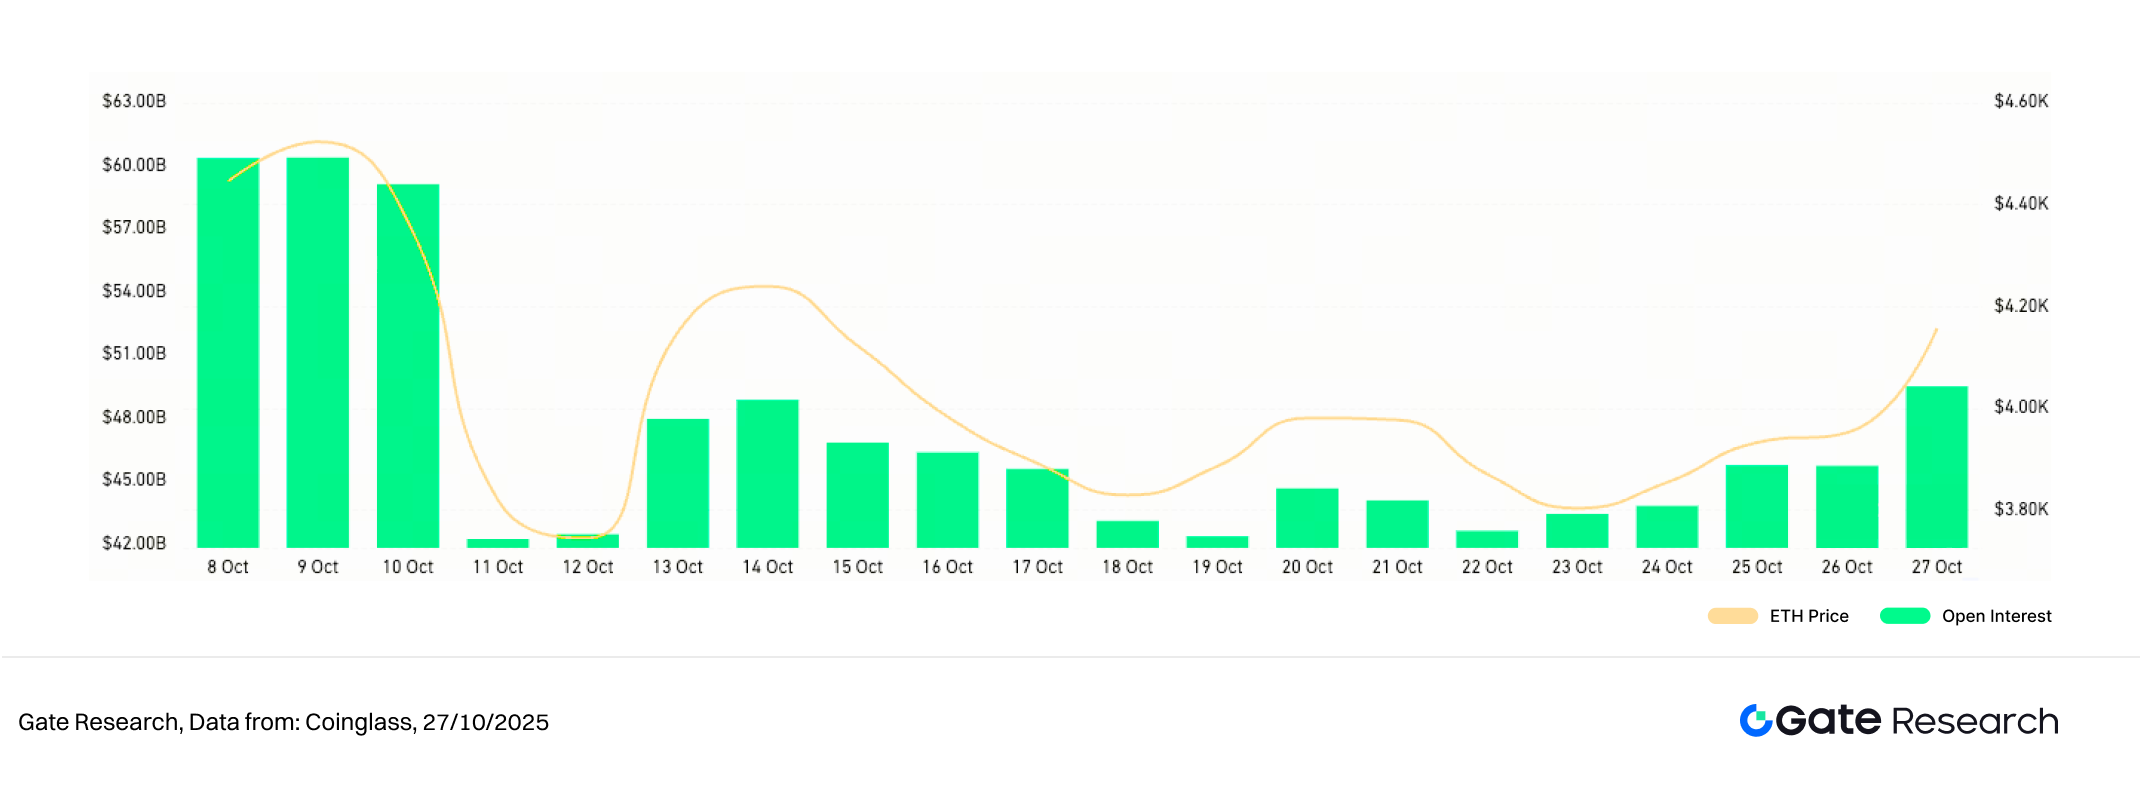
4. Funding Rate
The funding rates for BTC and ETH have generally remained in positive territory, indicating a mildly bullish market structure with a steady pace. BTC’s funding rate fluctuations have been minimal, hovering near zero, suggesting stable long-leverage positioning and continued confidence from institutional and mid- to long-term capital.【7】【8】
ETH’s funding rates have been more active, occasionally turning slightly negative during short-term corrections — particularly around mid- and late October — reflecting temporary risk aversion among short-term traders. However, these dips were brief and quickly recovered, showing no signs of systemic stress.
Overall, the market’s funding structure remains moderately bullish. Leveraged capital has not exited significantly, but sentiment is far from overheated. If funding rates continue to rise alongside expanding trading volume, this could signal momentum for an extended rally; conversely, if they turn negative for consecutive periods, it may indicate short-term sentiment deterioration and potential price correction risk.
Figure 7: BTC funding rates remain steadily positive, while ETH occasionally dips negative — reflecting a mildly bullish but measured market tone.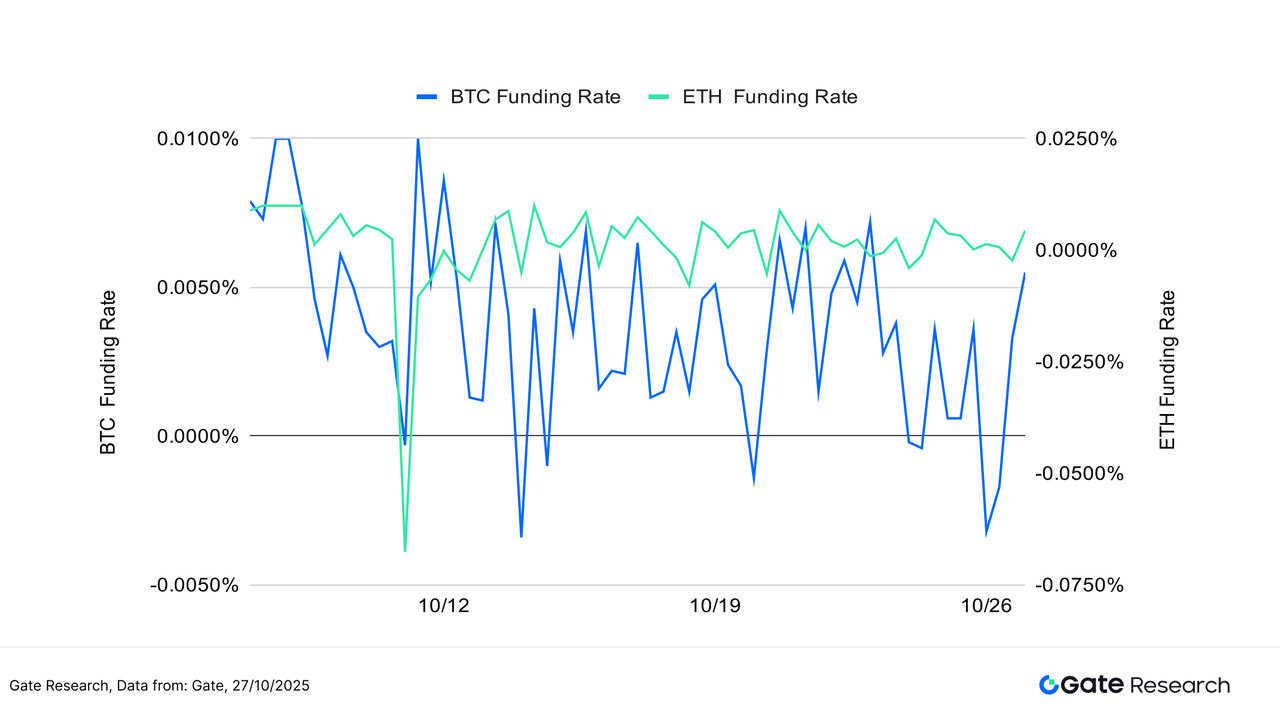
5. Cryptocurrency Liquidation Chart
According to Coinglass data, despite the crypto market remaining in a high-level consolidation phase during mid-October, frequent liquidation events occurred in the derivatives market, reflecting ongoing tug-of-war dynamics between long and short positions. On October 10, the market experienced the largest wave of liquidations, with over $18 billion in total positions cleared in a single day — including $16.7 billion in long liquidations — indicating that highly leveraged long positions were forcibly unwound during the sharp price drop.【9】
Over the following two weeks, long liquidations continued to surge multiple times, with daily totals often exceeding $500 million, suggesting that bullish traders remained under pressure during market pullbacks. Conversely, on October 21 and October 26, short liquidations increased significantly as prices rebounded, signaling stop-loss exits among short sellers and alternating pressure between both sides of the market.
Overall, while the scale of recent liquidations has not reached a systemic level, the high concentration of leveraged long positions indicates rising exposure to risk. If trading volumes fail to expand or volatility intensifies, market sentiment may turn cautious once again, and short-term liquidity stress could trigger a chain reaction.
Figure 8: Long liquidations surged in mid-October, while short liquidations increased on October 21 and 26, showing ongoing battles between bullish and bearish forces.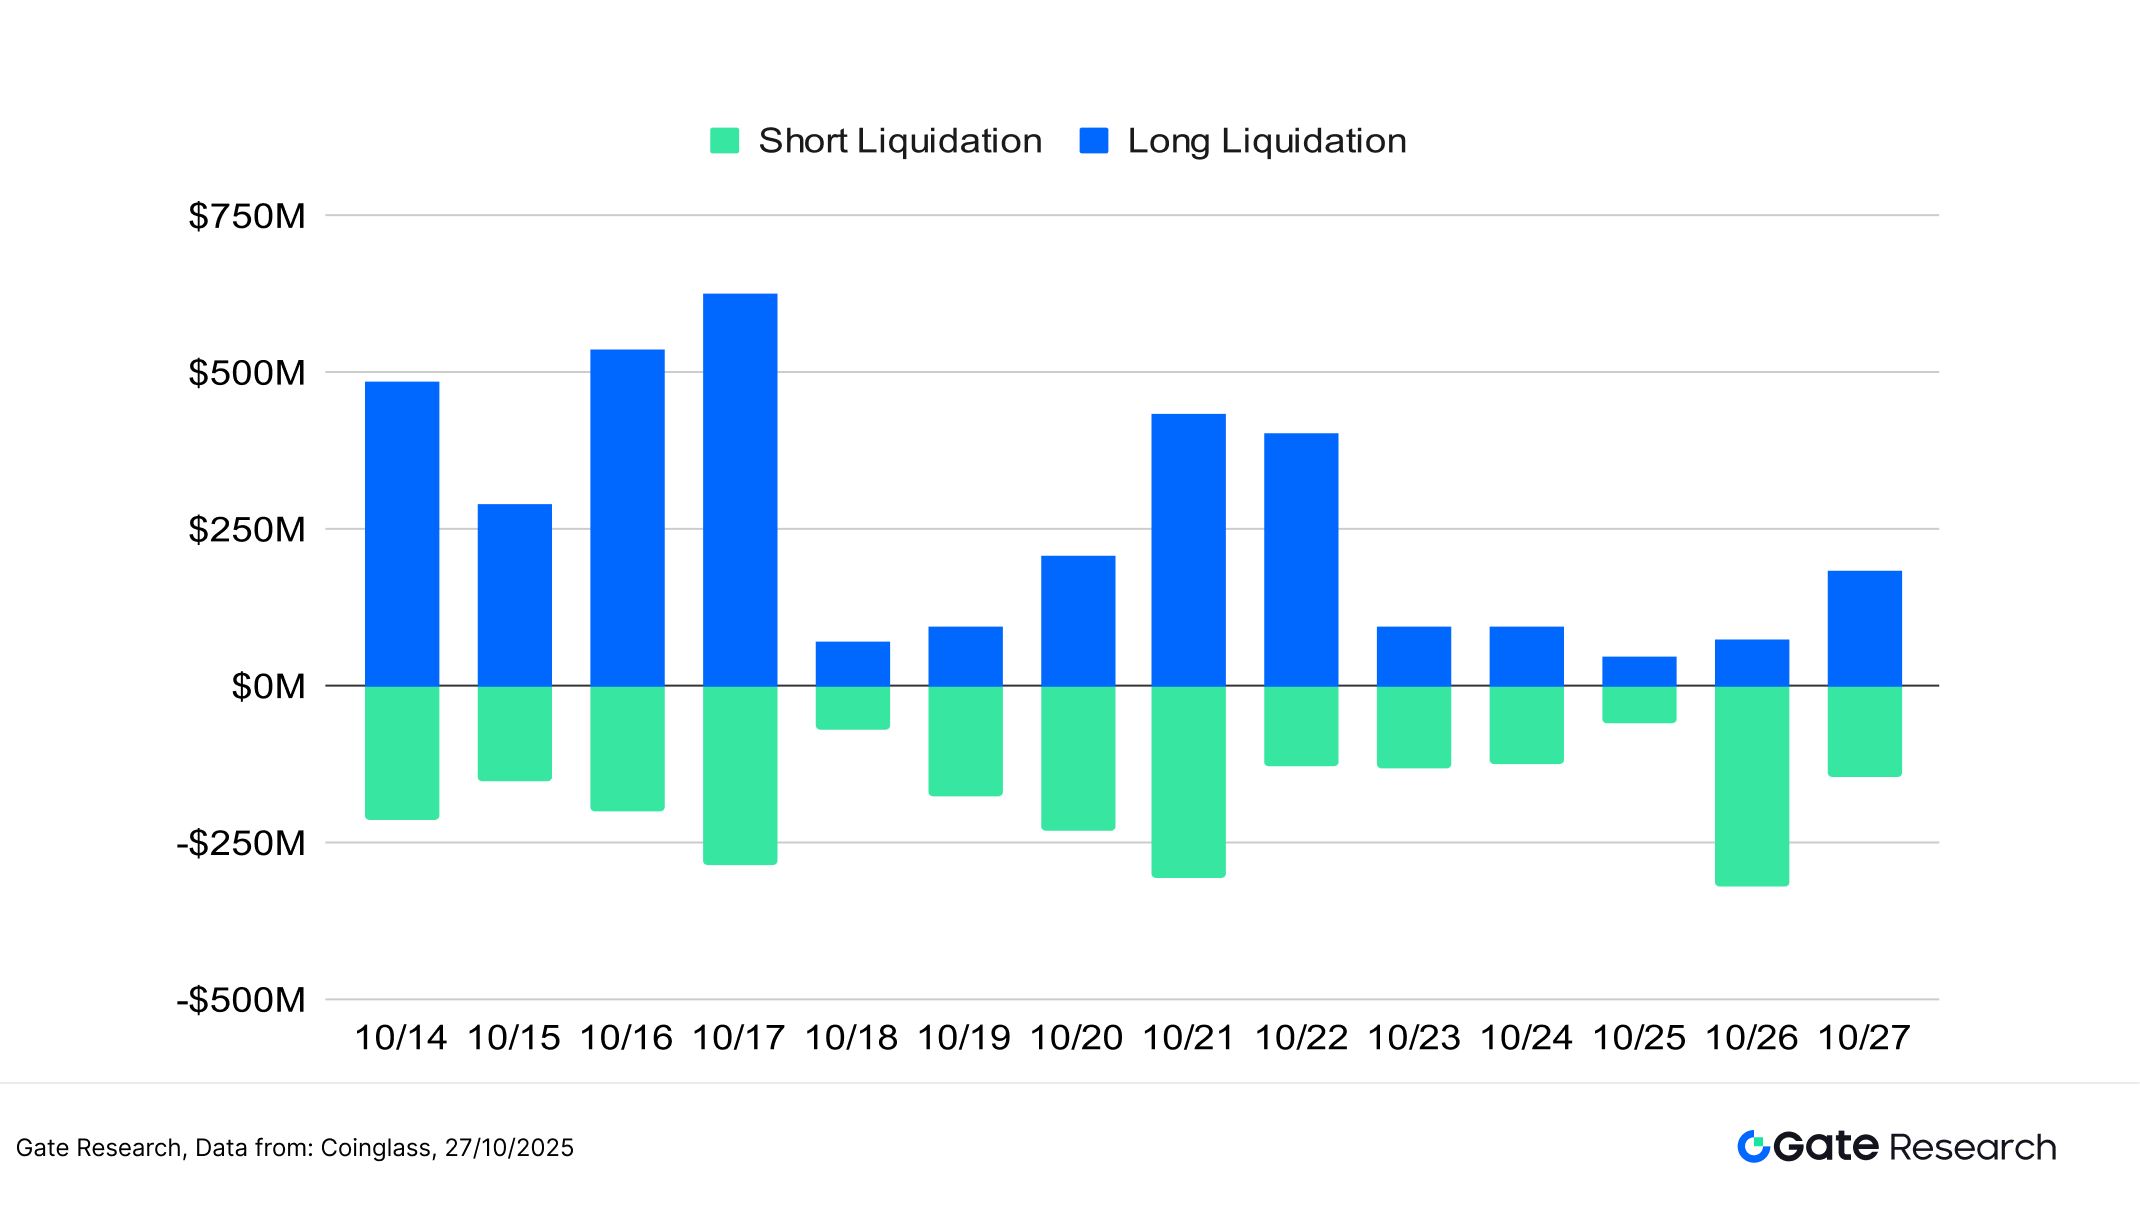
Against the backdrop of high-level consolidation and narrowing volatility, overall capital behavior in the crypto market remains moderately bullish but largely neutral. However, several derivatives and sentiment indicators show weakening buying momentum and slowing short-term strength. The LSR and long-short ratios have climbed back above 1, yet without significant volume expansion; funding rates remain positive but have not widened; and liquidation trends have shifted from alternating long-short pressure to concentrated long-side liquidations — all suggesting fading leverage confidence. The overall market structure remains stable, but sentiment support is weakening, limiting short-term trend continuity.
Given the marginal contraction in leveraged capital and growing divergence in long-short sentiment, investors should closely monitor key price zones and volatility indicators to determine whether the market’s consolidation will evolve into a trend reversal or a corrective rebound. The following section will therefore turn to an empirical evaluation of the RSI Trend Reversal Strategy, focusing on its adaptability in identifying overbought and oversold zones under varying market rhythms, capturing short-term reversal points, and assessing its practical performance in improving risk control efficiency, reducing emotional trading behavior, and optimizing entry-exit timing during range-bound conditions.
Quantitative Analysis – RSI Trend Reversal Strategy
(Disclaimer: All forecasts in this article are based on historical data and market trends and are for informational purposes only. They should not be considered investment advice or a guarantee of future market performance. Investors should carefully assess risks and make prudent decisions when engaging in related investments.)
1. Strategy Overview
The RSI Trend Reversal Strategy is a short-term trading approach designed to identify market sentiment shifts and capture price reversal opportunities using the Relative Strength Index (RSI). The strategy sets an RSI oversold threshold as an entry signal and an RSI overbought threshold as an exit condition, allowing traders to detect corrective momentum during periods of extreme sentiment. It focuses solely on long positions (buy trades). When the RSI enters the oversold zone, the strategy initiates a buy; positions are then closed when a take-profit, stop-loss, or overbought signal is triggered.
By combining dynamic take-profit and stop-loss mechanisms, the strategy aims to secure profits during rebound trends while minimizing losses in false reversal scenarios. It is particularly effective in range-bound or mean-reverting markets, where short-term price swings create frequent opportunities for entry and exit.
For this backtest, the strategy was applied to the top ten cryptocurrencies by market capitalization (excluding stablecoins), covering major public chains and high-liquidity assets. The objective was to evaluate its adaptability and practicality across different assets and market conditions, validating its feasibility and robustness for live deployment.
2. Core Parameter Settings
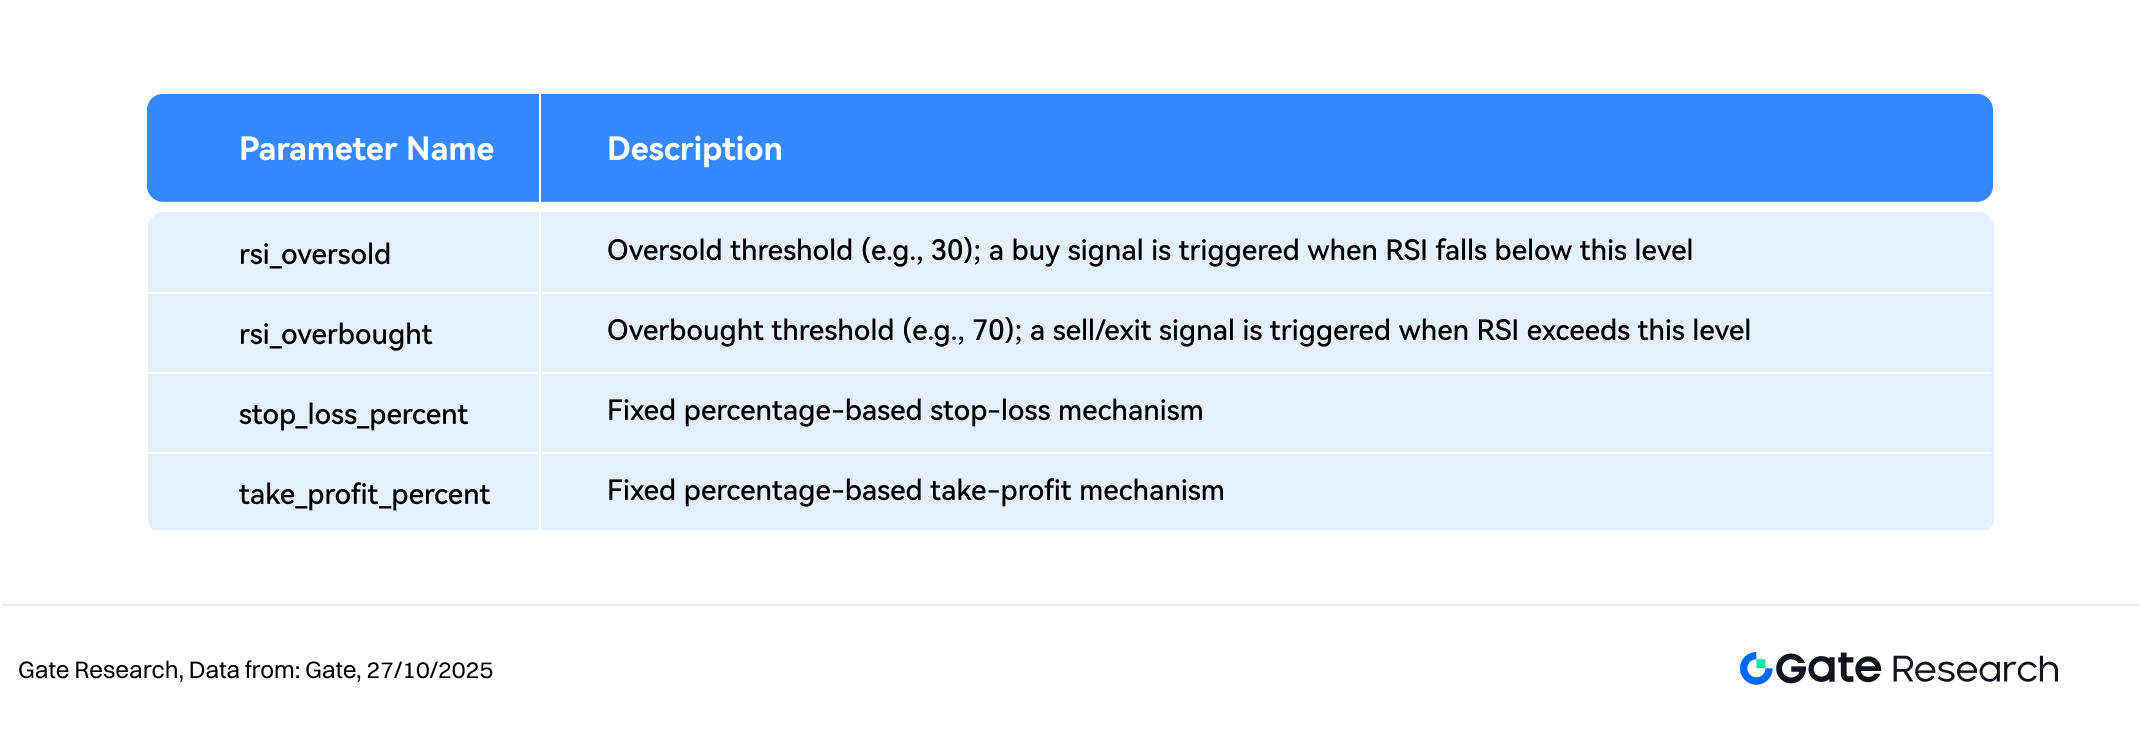
3. Strategy Logic and Operational Mechanism
Entry Conditions
- When there is no active position and the RSI falls below the rsi_oversold threshold, the market is considered oversold, triggering a buy signal.
Exit Conditions
- Overbought Exit: If RSI rises above the rsi_overbought threshold, a potential reversal is anticipated, triggering a sell signal.
- Stop-Loss Exit: If price falls to
entry_price× (1 −stop_loss_percent), a forced stop-loss is executed. - Take-Profit Exit: If price rises to
entry_price× (1 +take_profit_percent), a take-profit order is triggered.
Practical Example Chart
- Trading Signal Triggered
The chart below illustrates the strategy’s entry point on June 15, 2025, using the SUI/USDT 1-hour timeframe. After a prolonged decline, the RSI fell below the oversold level of around 20 in the early morning and quickly rebounded above 40, showing early signs of reversal. Meanwhile, the MACD’s fast line began converging toward the slow line, indicating momentum recovery, and trading volume started to pick up.
Although prices had not yet significantly rebounded from the bottom, the RSI rebound and volume uptick together satisfied the strategy’s “buy-the-dip” condition, triggering a long entry signal in anticipation of a short-term rebound.
Figure 9: SUI/USDT Entry Signal Example (June 15, 2025)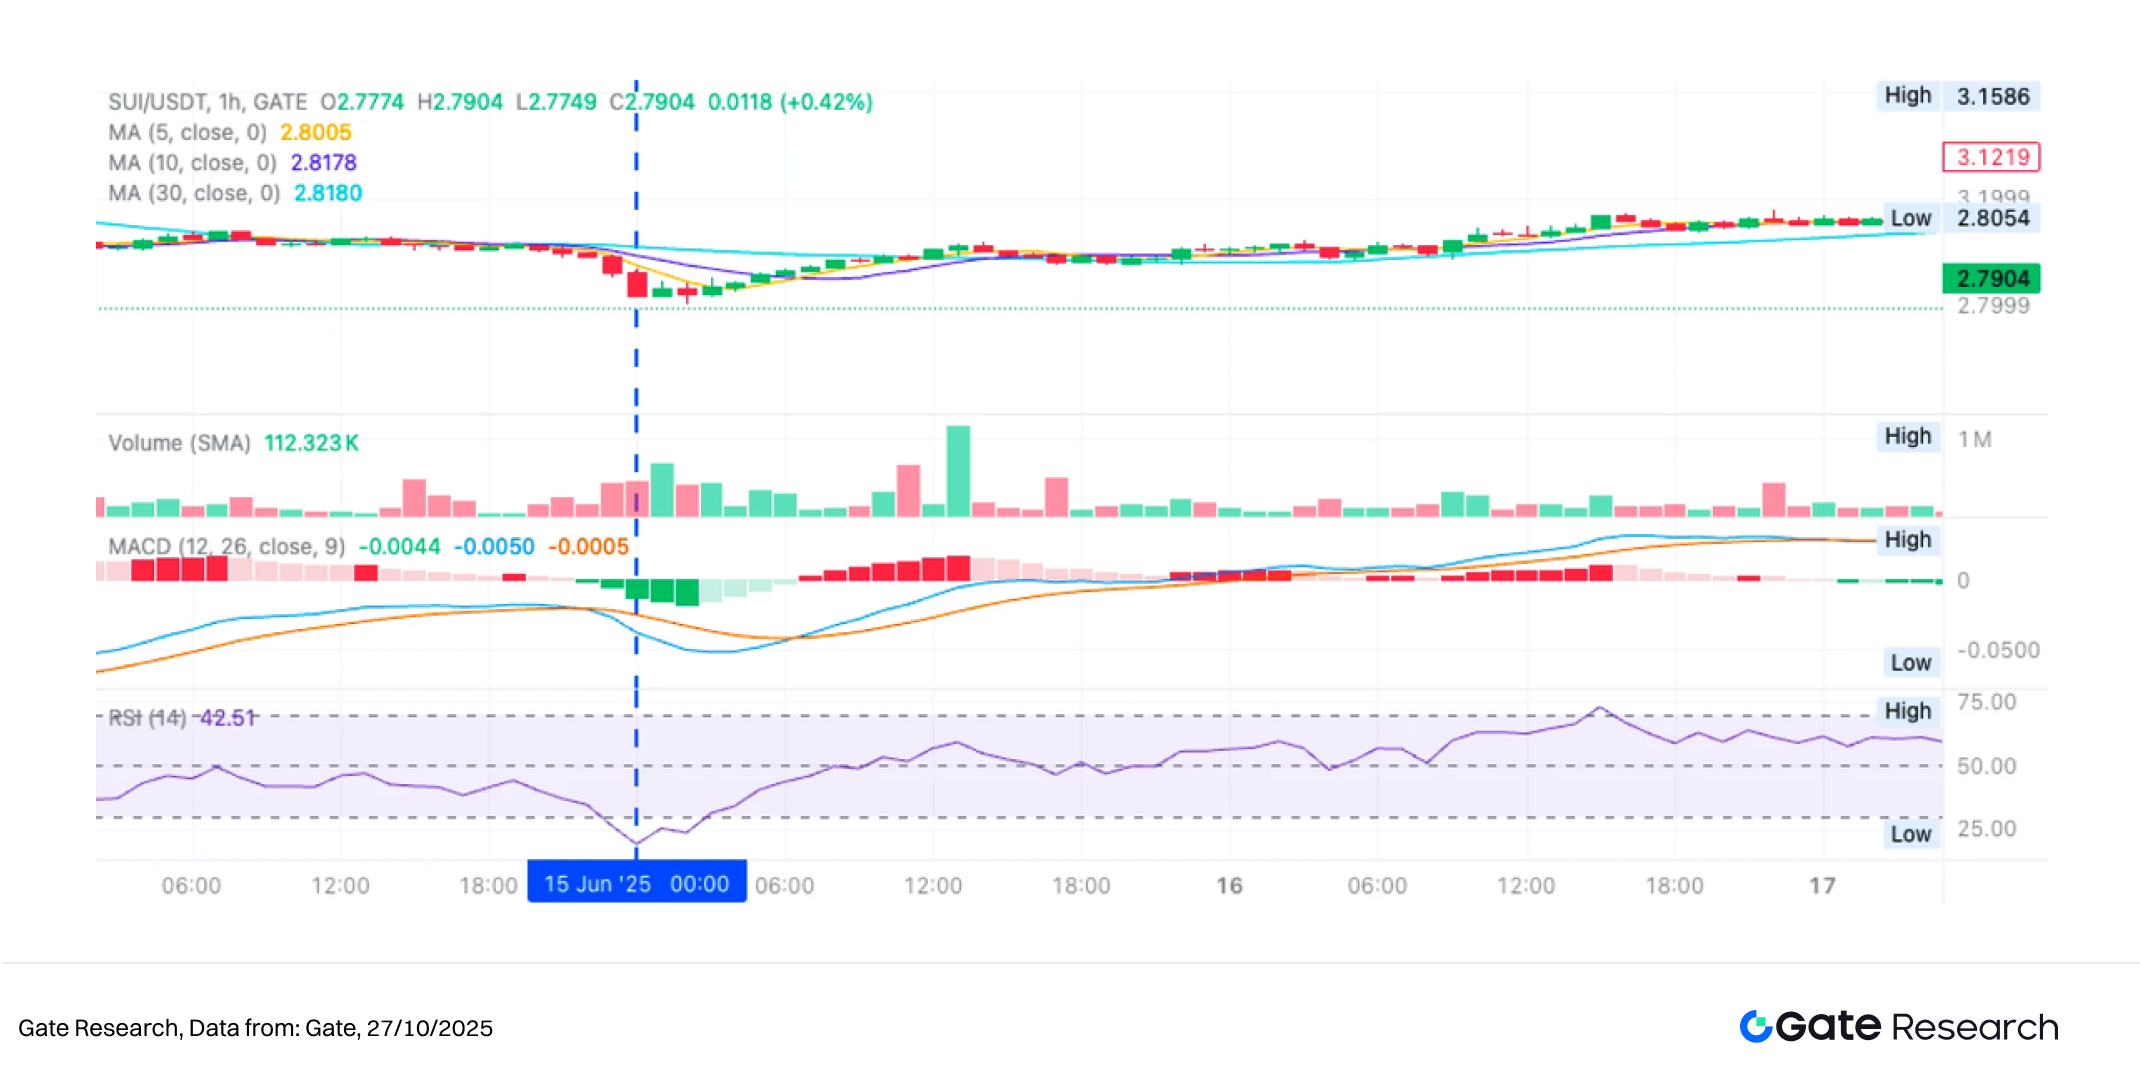
- Trading Action and Outcome
After the rebound, SUI’s price continued to oscillate upward, with RSI briefly exceeding 75 — entering the overbought zone. Momentum then weakened, and RSI began to fall, prompting the strategy to exit the position based on the overbought condition, securing profits from the prior price rally. Although prices rose slightly afterward, the MACD histogram showed shrinking bars and a flattening slope, indicating fading bullish momentum. Short-term moving averages also began converging, forming a classic “momentum exhaustion” pattern.
This exit aligned with the strategy’s “take profits when momentum overheats” risk-control logic, effectively avoiding the subsequent retracement. Future improvements could integrate dynamic trailing stops or trend-following modules to further enhance profit capture and holding efficiency.
Figure 10: SUI/USDT Exit Signal Example (June 16, 2025)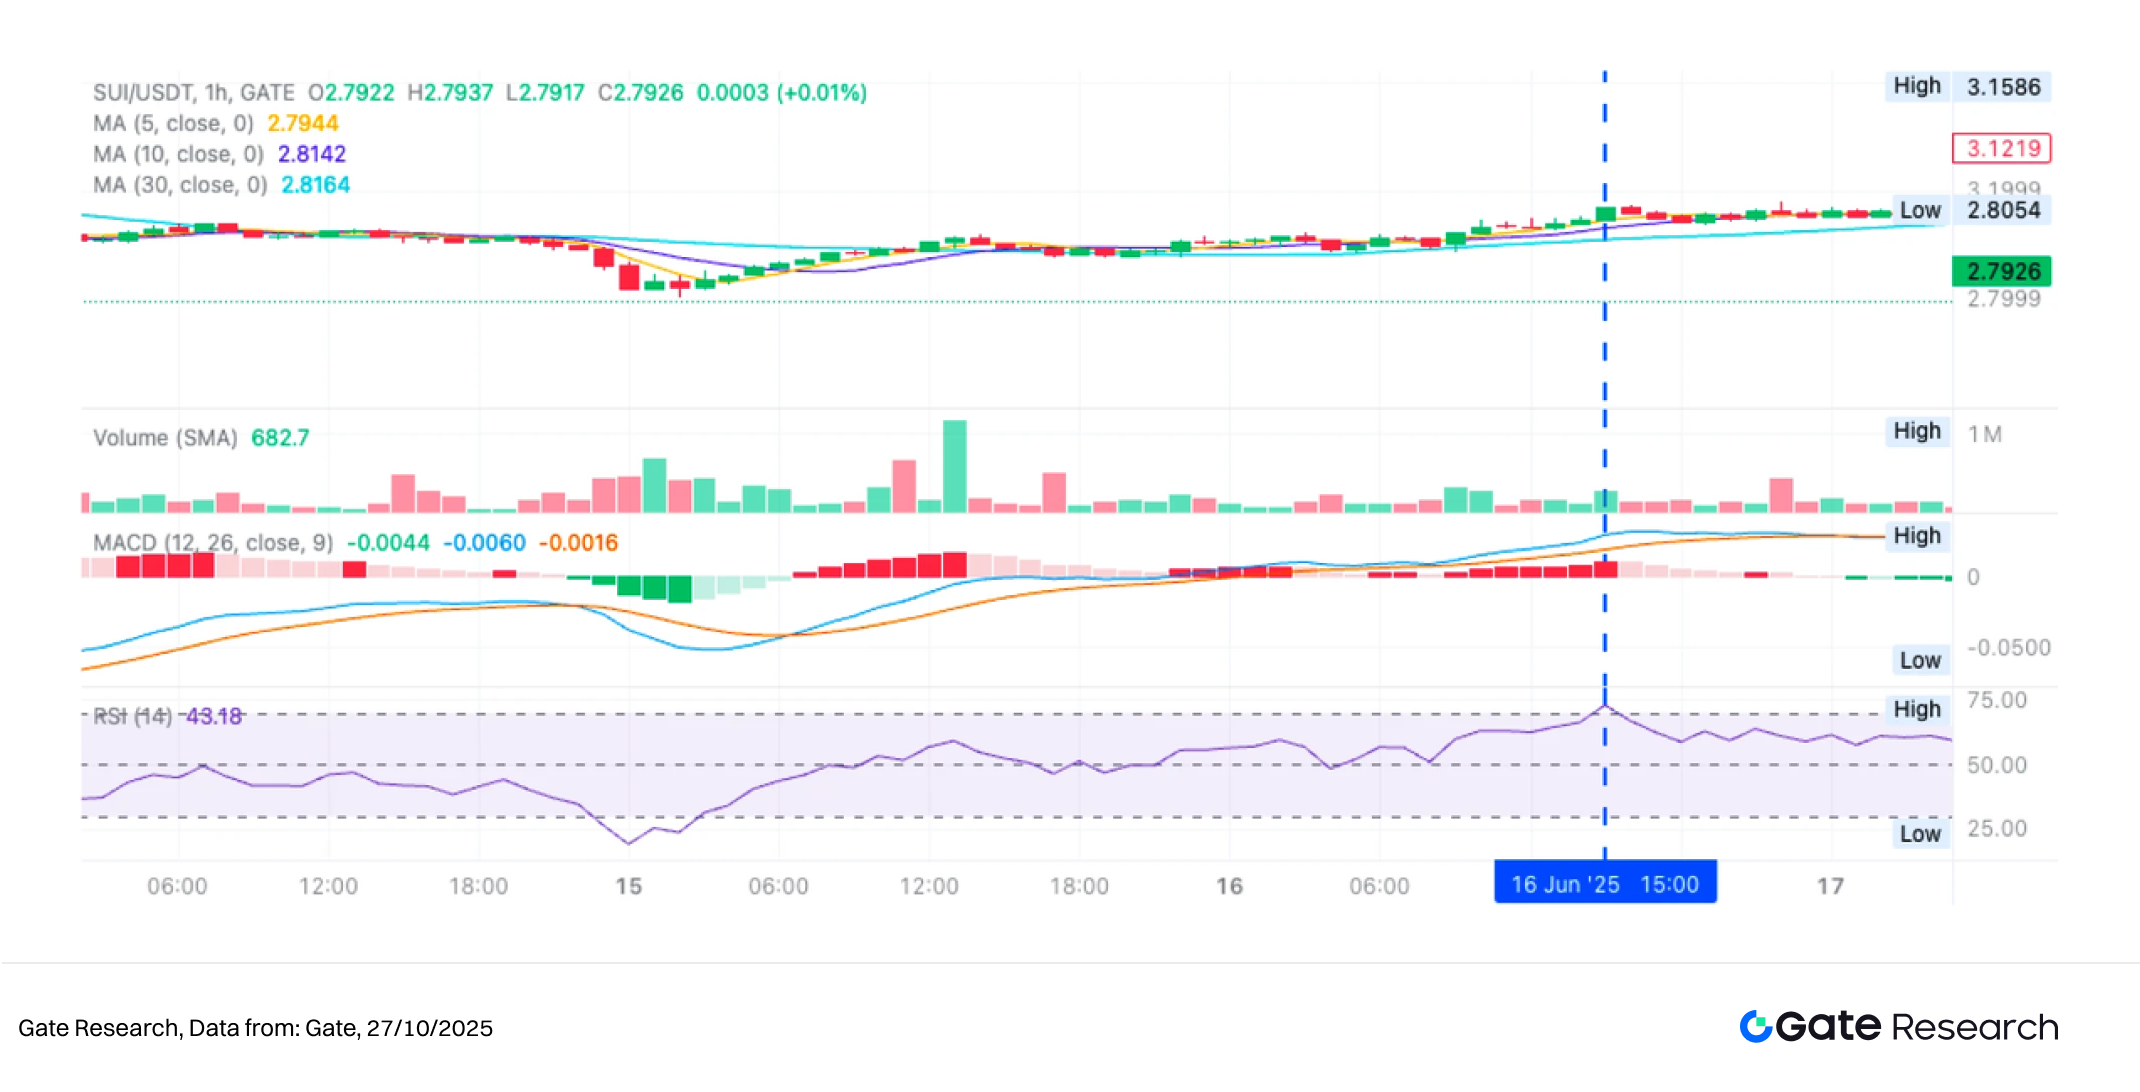
Through the above case study, the strategy’s entry-exit logic and dynamic risk management can be clearly observed during periods of extreme market sentiment. The RSI indicator helps identify oversold rebounds and overbought slowdowns: when RSI drops below a defined threshold, the strategy enters a position to capture rebound momentum; when RSI rises to overbought territory or reaches profit/loss limits, it exits promptly to lock in gains and control downside risk.
Within limited drawdowns, the strategy successfully captured a segment of the short-term uptrend, demonstrating its reversal detection capability and discipline in execution under choppy market conditions. This case not only validates the RSI strategy’s real-world applicability and defensive strength, but also provides a foundation for future improvements such as parameter optimization, multi-factor indicator integration, and cross-asset strategy expansion.
4. Practical Backtesting Example
Parameter Backtesting Setup
To identify optimal parameters, a systematic grid search was conducted across the following ranges:
rsi_overbought: 60 to 95 (step size: 5)rsi_oversold: 5 to 30 (step size: 5)stop_loss_percent: 1% to 2% (step size: 0.5%)take_profit_percent: 10% to 16% (step size: 5%)
Using the top 10 cryptocurrencies by market capitalization (excluding stablecoins) as test assets, this backtest analyzed 4-hour candlestick data from October 2024 to October 2025, testing a total of 288 parameter combinations. The top ten combinations were selected based on annualized return performance. Evaluation metrics included annualized return, Sharpe ratio, maximum drawdown, and ROMAD (Return Over Maximum Drawdown) to comprehensively assess the strategy’s stability and risk-adjusted performance under different market conditions.
Figure 11: BTC and ETH Strategy Performance Comparison Table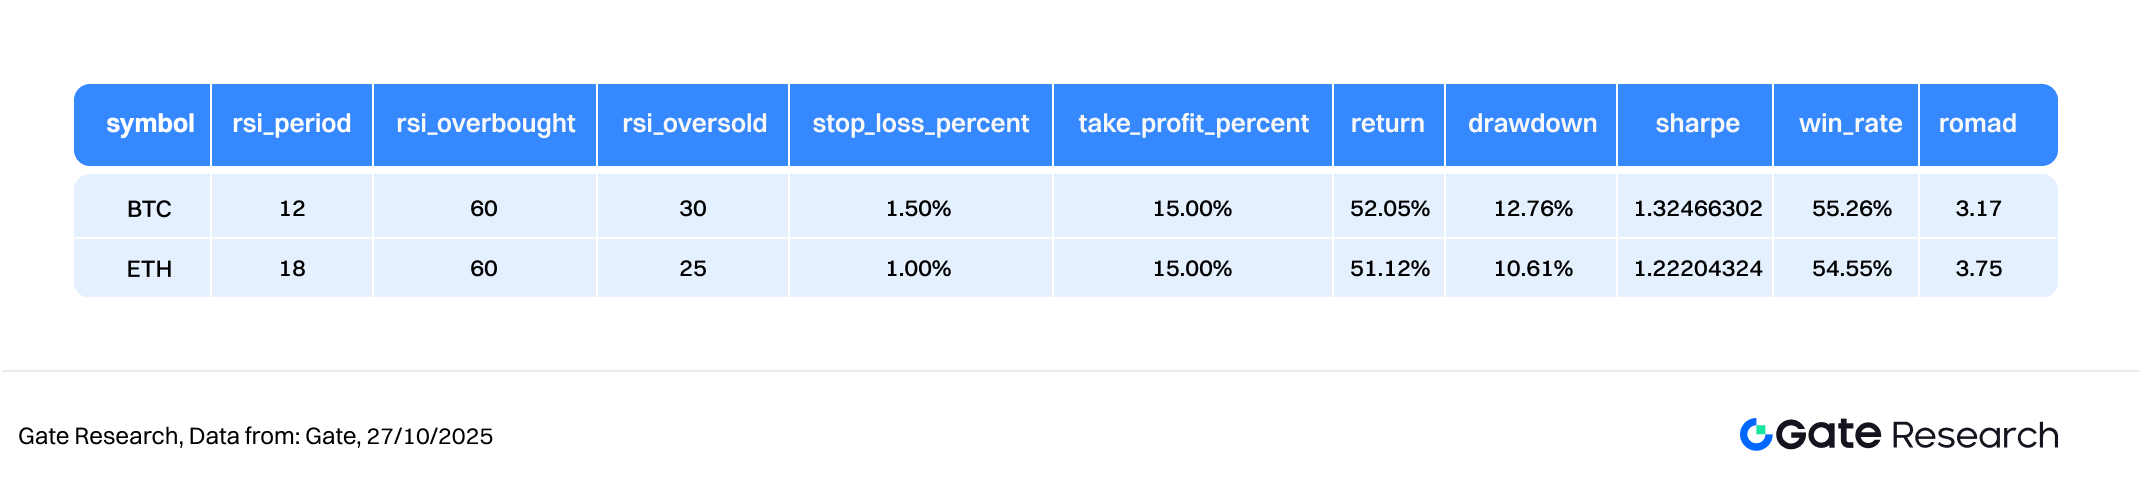
Strategy Logic Description
When the system detects that the RSI indicator falls below the preset oversold threshold, it interprets this as the market entering an emotionally extreme low zone and immediately triggers a buy signal. This logic aims to capture the early phase of short-term reversals by identifying points where buying momentum may reemerge, combined with dynamic take-profit and stop-loss mechanisms for enhanced risk control. If RSI subsequently rises into the overbought zone or the price reaches the predefined take-profit or stop-loss level, the system automatically executes a sell signal, locking in profits or minimizing losses.
For example, the BTC configuration used in this backtest was:
rsi_oversold= 60 (entry signal when RSI falls below this level)rsi_overbought= 30 (exit signal when RSI rises above this level)stop_loss_percent= 1.5%take_profit_percent= 15%
Performance and Results Analysis
The backtesting period spanned October 2024 to June 2025, applying the RSI overbought/oversold logic to major crypto assets. Overall performance was stable, with BTC and ETH cumulative return curves showing a stepwise upward trajectory and limited volatility—demonstrating the strategy’s defensive strength and steady profitability in mid- to long-term consolidation markets.
As of October 2025, the BTC strategy achieved a cumulative return of approximately 52%, and ETH about 51%, with similar trajectories. Minor differences were attributed to variations in short-term reversal amplitude and trading volume. The strategy maintained low drawdowns throughout the test period, preserving profits through multiple market corrections and resulting in a smooth upward performance curve.
Overall, the RSI strategy maintained a stable risk-return profile across major cryptocurrencies, delivering consistent results even in non-trending environments, thus validating its effectiveness in range-bound markets.
In contrast, the Gate Quant Fund, which focuses on market-neutral arbitrage and hedging strategies, emphasizes stable returns and risk management. Through a rigorous risk-control framework, it seeks long-term compounded performance, offering investors a balanced and low-volatility quantitative allocation approach.
Figure 12: Comparison of Cumulative Returns over the Past Year – RSI Optimal Parameter Strategy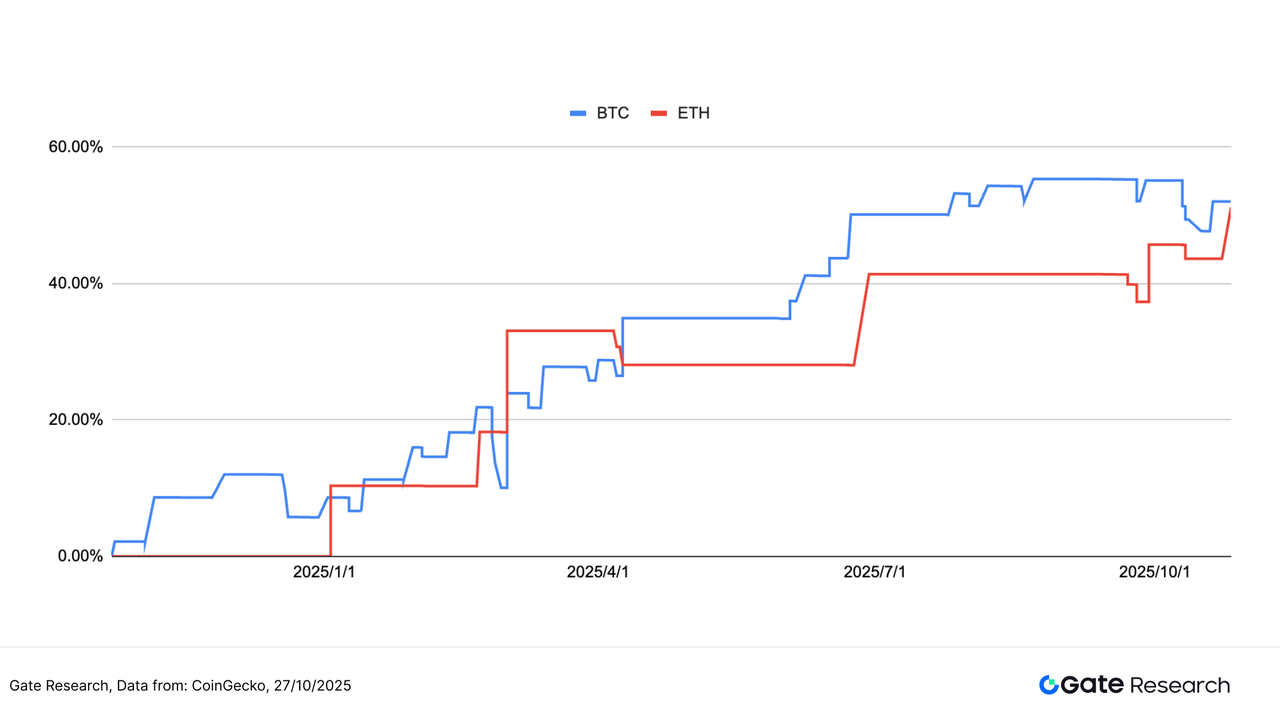
5. Strategy Summary
The RSI Trend Reversal Strategy, built around RSI as the core signal and enhanced by dynamic take-profit and stop-loss mechanisms, demonstrated stable returns and strong reversal-capturing capabilities across multiple major cryptocurrencies. Backtesting results show that both BTC and ETH strategies achieved approximately 50% cumulative returns, with stepwise upward performance curves, underscoring their stability in neutral or sideways markets. The strategy effectively limited drawdowns and maintained positive returns through multiple market fluctuations, resulting in smooth and resilient performance.
Although short-term reversal models have strong profit potential, they may underperform in one-sided trending markets due to premature exits caused by persistent overbought signals, limiting upside capture. Therefore, in real-world investment applications, balancing volatility control and compound growth remains a key goal in quantitative asset management.
Based on this principle, the Gate Quant Fund focuses on market-neutral arbitrage and hedging strategies, targeting steady returns with robust risk management. To help users experience the long-term compounding benefits of stable quantitative strategies, Gate has launched a “Quant Fund New User Bonus Rate Campaign” running from October 27, 2025, 06:00 to November 10, 2025, 06:00 (UTC). During this period, first-time subscribers can enjoy an additional +5% annualized yield over 14 days, with a total annualized return exceeding 19%.
The fund is managed by a top-tier asset management team, featuring a diversified portfolio across arbitrage and hedging strategies. Its primary objective is to control drawdowns while balancing risk and return, making it ideal for investors seeking low-volatility, long-term, and sustainable quantitative returns.
Conclusion
Between October 14 and October 27, 2025, the crypto market continued its high-level consolidation phase, with marginal weakening in both capital flows and sentiment. Although BTC and ETH remained technically intact, their volatility and trading volumes contracted further, indicating a slowdown in momentum. LSR and funding rates stayed mildly bullish but showed no expansion, reflecting cautious optimism among long positions.
In the derivatives segment, BTC open interest recovered after a brief drop, while ETH showed steady growth; funding rates remained moderately positive, and leveraged capital had not significantly withdrawn. The October 10 liquidation event highlighted the fragility of excessive leverage, prompting increased defensive positioning. The market remains in the late phase of consolidation, with structural rotation and position reshuffling coexisting — absent new inflows, downside risks persist.
Within this context, the RSI-based reversal strategy demonstrated strong real-world potential. Backtest results showed ~50% cumulative returns for both BTC and ETH, with stable, upward-trending equity curves and effective drawdown control. However, high-beta tokens may underperform during one-sided rallies due to repeated overbought exits. Future optimizations could integrate dynamic thresholds, volatility filters, and volume factors to further refine signal quality and enhance adaptability across market cycles.
In contrast, the Gate Quant Fund continues to prioritize market-neutral and hedging strategies, aiming for steady, risk-adjusted returns. Through strict risk management and diversified asset allocation, the fund delivers stable compounding performance under controlled drawdowns — offering investors seeking resilience in volatile markets a superior path toward sustainable quantitative investing.
References:
- CoinGecko, https://www.coingecko.com/
- Gate, https://www.gate.com/trade/BTC_USDT
- Gate, https://www.gate.com/trade/ETH_USDT
- Sosovalue, https://sosovalue.com/assets/etf/us-btc-spot?from=moved
- Coinglass, https://www.coinglass.com/LongShortRatio
- Coinglass, https://www.coinglass.com/BitcoinOpenInterest?utm_source=chatgpt.com
- Gate, https://www.gate.com/futures_market_info/BTC_USD/capital_rate_history
- Gate, https://www.gate.com/futures/introduction/funding-rate-history?from=USDT-M&contract=ETH_USDT
- Coinglass, https://www.coinglass.com/pro/futures/Liquidations
- Gate, https://www.gate.com/institution/quant-fund
Gate Research is a comprehensive blockchain and cryptocurrency research platform that provides deep content for readers, including technical analysis, market insights, industry research, trend forecasting, and macroeconomic policy analysis.
Disclaimer
Investing in cryptocurrency markets involves high risk. Users are advised to conduct their own research and fully understand the nature of the assets and products before making any investment decisions. Gate is not responsible for any losses or damages arising from such decisions.
Share


Related Articles

Reflections on Ethereum Governance Following the 3074 Saga

Gate Research: 2024 Cryptocurrency Market Review and 2025 Trend Forecast
Perpetual Contract Funding Rate Arbitrage Strategy in 2025

Gate Research: BTC Breaks $100K Milestone, November Crypto Trading Volume Exceeds $10 Trillion For First Time

NFTs and Memecoins in Last vs Current Bull Markets
