Trade
Trading Type
Spot
Trade crypto freely
Alpha
Points
Get promising tokens in streamlined on-chain trading
Pre-Market
Trade new tokens before they are officially listed
Margin
Magnify your profit with leverage
Convert & Block Trading
0 Fees
Trade any size with no fees and no slippage
Leveraged Tokens
Get exposure to leveraged positions simply
Futures
Futures
Hundreds of contracts settled in USDT or BTC
Options
HOT
Trade European-style vanilla options
Unified Account
Maximize your capital efficiency
Demo Trading
Futures Kickoff
Get prepared for your futures trading
Futures Events
Participate in events to win generous rewards
Demo Trading
Use virtual funds to experience risk-free trading
Earn
Launch
Investment
Simple Earn
VIP
Earn interests with idle tokens
Auto-Invest
Auto-invest on a regular basis
Dual Investment
Buy low and sell high to take profits from price fluctuations
Quant Fund
VIP
Top asset management team helps you profit without hassle
Crypto Loan
0 Fees
Pledge one crypto to borrow another
Lending Center
One-Stop Lending Hub
VIP Wealth Hub
New
Customized wealth management empowers your assets growth
Private Wealth Management
Customized asset management to grow your digital assets
Staking
Stake cryptos to earn in PoS products
BTC Staking
HOT
Stake BTC and earn 10% APR
GUSD Minting
New
Use USDT/USDC to mint GUSD for treasury-level yields
Soft Staking
Earn rewards with flexible staking
More


- Trending TopicsView More
50.9K Popularity
103.9K Popularity
222.9K Popularity
167K Popularity
17.3K Popularity
- Pin
Why $145,000 target is next for Bitcoin by December 2025
Technical indicators suggest that Bitcoin (BTC) could potentially surpass $140,000 before the end of 2025 despite the ongoing consolidation phase.
This projection is based on an outlook by prominent online cryptocurrency analyst TradingShot, who, in a TradingView post on September 30, highlighted the asset’s 20-period moving average (1W MA20) as the key guide to this target.
TradingShot**TradingView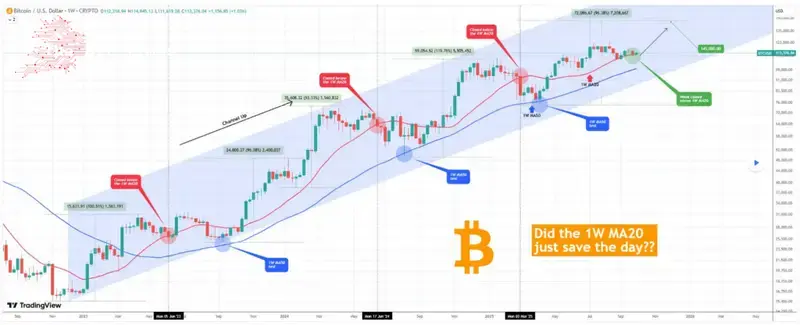 Bitcoin price analysis. Source: TradingView
![]() Bitcoin price analysis. Source: TradingView**Bitcoin price analysis. Source: TradingViewAccording to the expert’s observation, this indicator has historically guided Bitcoin’s bullish continuation and is currently defining momentum
Bitcoin price analysis. Source: TradingView**Bitcoin price analysis. Source: TradingViewAccording to the expert’s observation, this indicator has historically guided Bitcoin’s bullish continuation and is currently defining momentum
Since April 2025, Bitcoin has sustained its uptrend each time weekly candles closed above the 1W MA20. In the rare cases when price action slipped below this threshold, most notably in June 2023, the decline continued until it tested or approached the 1W MA50, the longer-term blue trendline.
Recent market action has reinforced the importance of this level. For the third time since August 25, Bitcoin closed the week above the 1W MA20, cementing its role as support. This confirmation strengthens the case for higher prices as long as the level continues to hold.
Historically, when Bitcoin has bounced from this structure, rallies have exceeded 90%. Even the weakest advance of the current cycle reached 96.38%. A similar move from the present setup projects an upside target of around $145,000 by December.
Bitcoin price analysis
At press time, Bitcoin was trading at $113,000, having corrected slightly by 0.7% in the past 24 hours, while gaining nearly 3% over the past week.
This setup reflects a healthy longer-term uptrend, as the price remains well above its 200-day average, a key indicator of sustained bullish momentum
However, trading slightly under the 50-day SMA suggests short-term consolidation rather than immediate breakout strength.
Meanwhile, the 14-day RSI at 52.51 signals a neutral stance, neither overbought nor oversold, indicating balanced momentum.
Featured image via Shutterstock
Featured image via ShutterstockFeatured image via Shutterstock