XRP Forms Double Bottom at $2.7, Analysts Identify Level as Oversold Zone

Last Updated 2026-03-29 06:24:29
Reading Time: 1m
XRP has formed a double bottom at $2.7. Analysts consider this level to be an oversold zone, suggesting it could present a buying opportunity for investors.

What Is a Double Bottom Pattern?

A double bottom is a widely recognized technical analysis pattern that usually appears at the end of a prolonged downtrend, indicating a potential market reversal. This pattern is defined by two low points (troughs) with a peak (intervening high) in between. When the price breaks above the level of the intervening peak, it is commonly viewed as a buy signal.

Double Bottom Formation in XRP


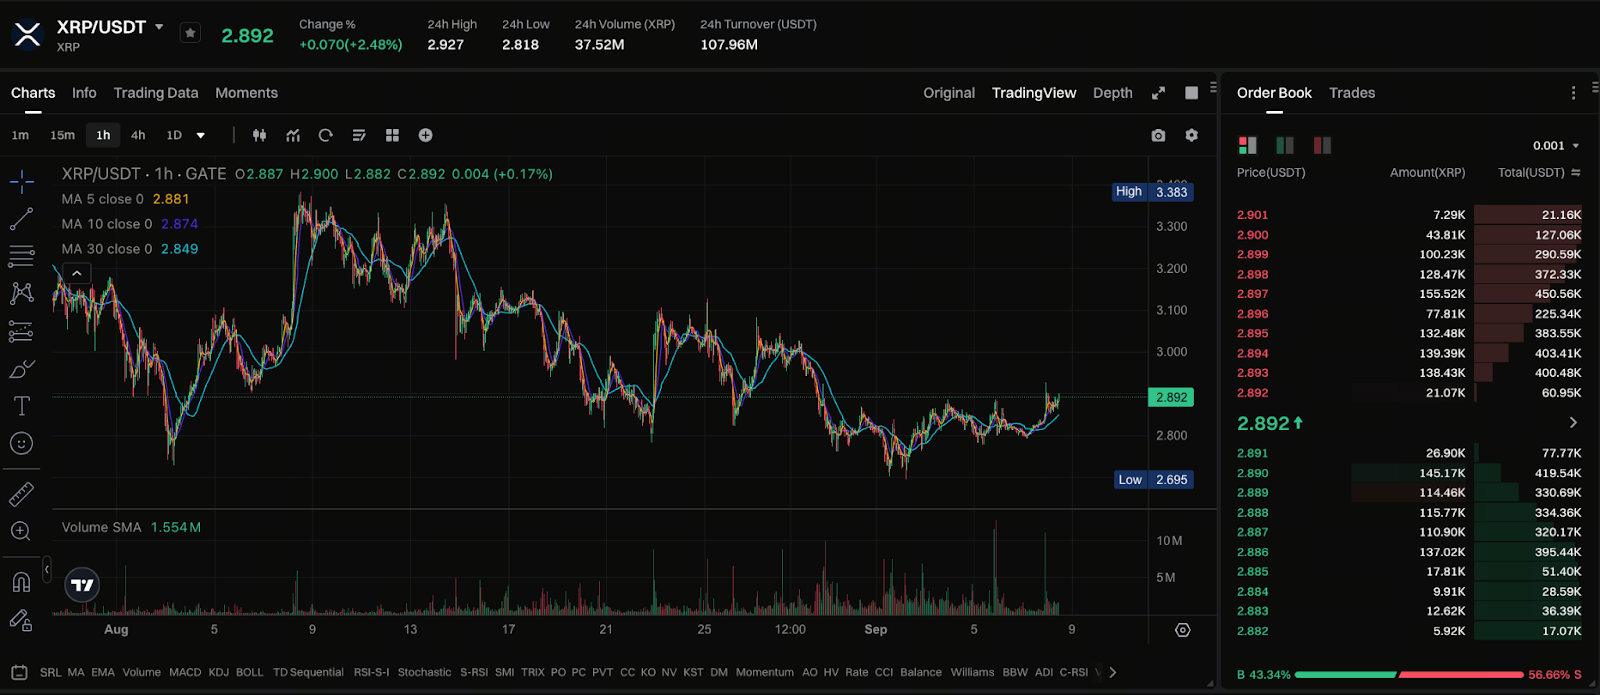
Chart: https://www.gate.com/trade/XRP_USDT

XRP recently formed a double bottom pattern at $2.70. Analysts highlight that this area may represent an oversold zone, suggesting a potential price rebound. If XRP surpasses the current resistance at $2.83, further upside could follow.

Market Outlook

Analyst Oscar Ramos points out that September is typically a weak month for the cryptocurrency market, whereas October and November tend to demonstrate stronger price appreciation. He also notes that several market catalysts are anticipated in the coming months, including Federal Reserve meetings and the release of key economic indicators, both of which could influence XRP’s price.

Conclusion

The double bottom pattern formed by XRP at $2.70 may serve as a technical buy signal. Should the price break above the current resistance at $2.83, additional gains may be possible. Nonetheless, investors should remain aware of market uncertainty and conduct comprehensive risk assessments before making investment decisions.

Author: Max
Disclaimer
* The information is not intended to be and does not constitute financial advice or any other recommendation of any sort offered or endorsed by Gate.
* This article may not be reproduced, transmitted or copied without referencing Gate. Contravention is an infringement of Copyright Act and may be subject to legal action.

Related Articles

What is Fartcoin? All You Need to Know About FARTCOIN
Intermediate

What is Fartcoin? All You Need to Know About FARTCOIN

Fartcoin (FARTCOIN) is a representative meme coin within the Solana ecosystem based on an AI-driven narrative. Its core concept originated from an experiment aimed at exploring the "boundaries between AI Agents and humor." More than just a digital asset with social attributes, the project deeply couples absurd humor culture with on-chain financial logic by integrating autonomous AI interaction models.
2026-04-04 22:01:19
Gold Price Forecast for the Next Five Years: 2026–2030 Trend Outlook and Investment Implications, Could It Reach $6,000?
Beginner

Gold Price Forecast for the Next Five Years: 2026–2030 Trend Outlook and Investment Implications, Could It Reach $6,000?

Analyze current gold price trends alongside authoritative five-year forecasts, integrating an evaluation of market risks and opportunities. This gives investors insight into the potential trajectory of gold prices and the main drivers expected to shape the market over the next five years.
2026-03-25 18:13:30
Aster vs Hyperliquid: Which Perp DEX Will Prevail?
Beginner

Aster vs Hyperliquid: Which Perp DEX Will Prevail?

Aster and Hyperliquid are the two representative protocols of the "purpose-built L1 path" within the current decentralized perpetual exchange (Perp DEX) sector. As a pioneer in the field, Hyperliquid has built a deep liquidity moat through its highly mature order book architecture and strong community consensus. Conversely, Aster, as a rising challenger, seeks to leapfrog the competition in high-performance trading through more aggressive multi-chain aggregation logic, private transaction modules, and an underlying execution environment optimized for 2026 market demands.
2026-03-24 11:58:33
2026 Silver Price Forecast: Bull Market Continuation or High-Level Pullback? In-Depth Analysis of Silver Candlestick Chart
Beginner

2026 Silver Price Forecast: Bull Market Continuation or High-Level Pullback? In-Depth Analysis of Silver Candlestick Chart

2026 Silver Price Forecast: Latest Outlook This article integrates current market trends, silver candlestick chart analysis, and momentum factors to assess the potential key support and resistance levels, upside targets, and pullback risks for silver prices. The goal is to help investors make informed, rational decisions.
2026-03-25 16:08:59
ASTER Tokenomics: Buybacks, Burns, and Staking as the Value Foundation of ASTER in 2026
Beginner

ASTER Tokenomics: Buybacks, Burns, and Staking as the Value Foundation of ASTER in 2026

ASTER is the native equity and governance token of the Aster ecosystem, with its core value built upon a radical "Deflationary Engine." Beyond serving as a governance tool, ASTER integrates multiple utilities including staking rewards, trading fee discounts, and liquidity incentives. Through its deep integration with the upcoming dedicated Layer 1 mainnet, it enables direct value capture from protocol cash flow to token holders.
2026-03-25 07:38:07
Crypto Future Profit Calculator: How to Calculate Your Potential Gains
Beginner

Crypto Future Profit Calculator: How to Calculate Your Potential Gains

Crypto Future Profit Calculator helps traders estimate potential earnings from futures contracts by considering entry price, leverage, fees, and market movement.
2026-04-03 23:27:09