


#GateSquareMayTradingShare
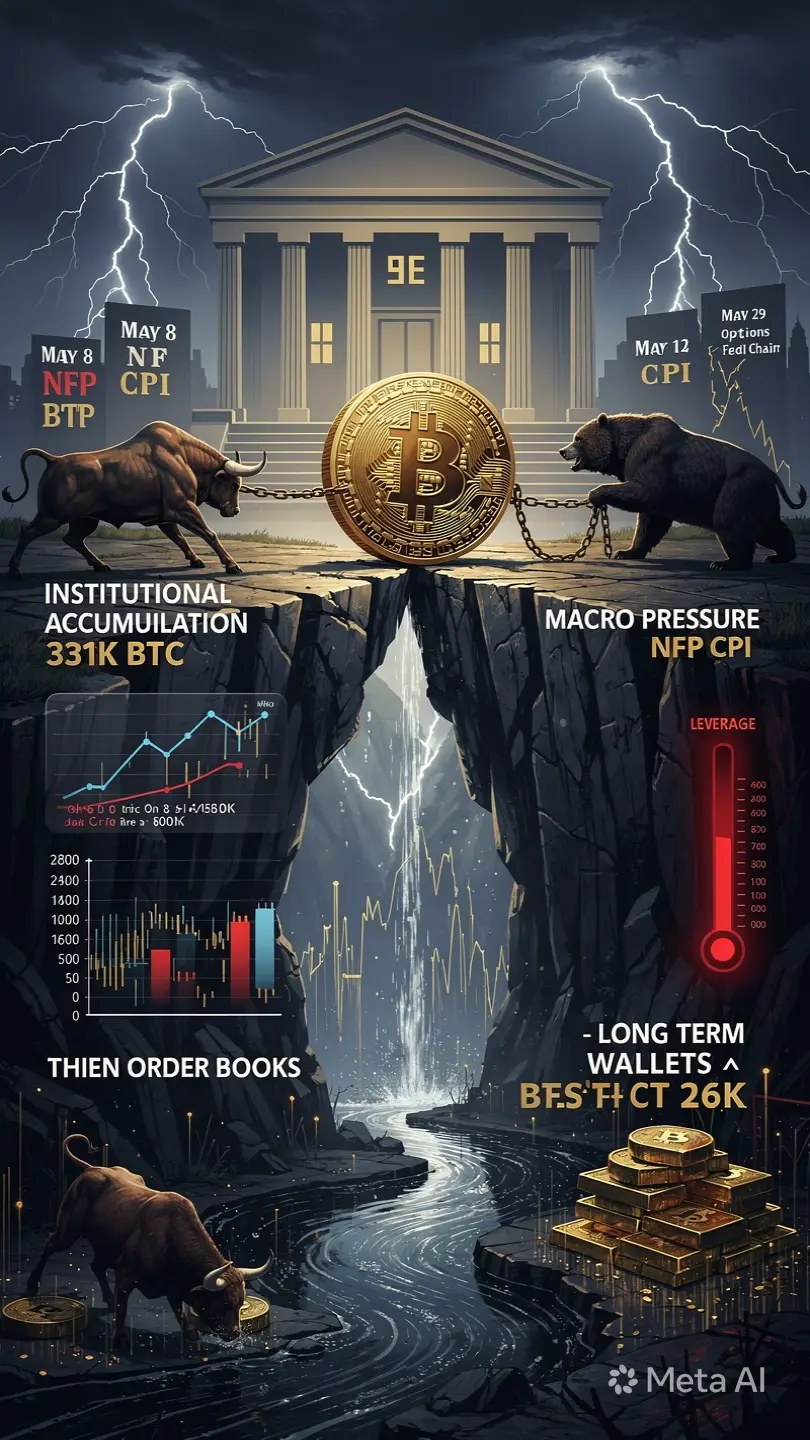
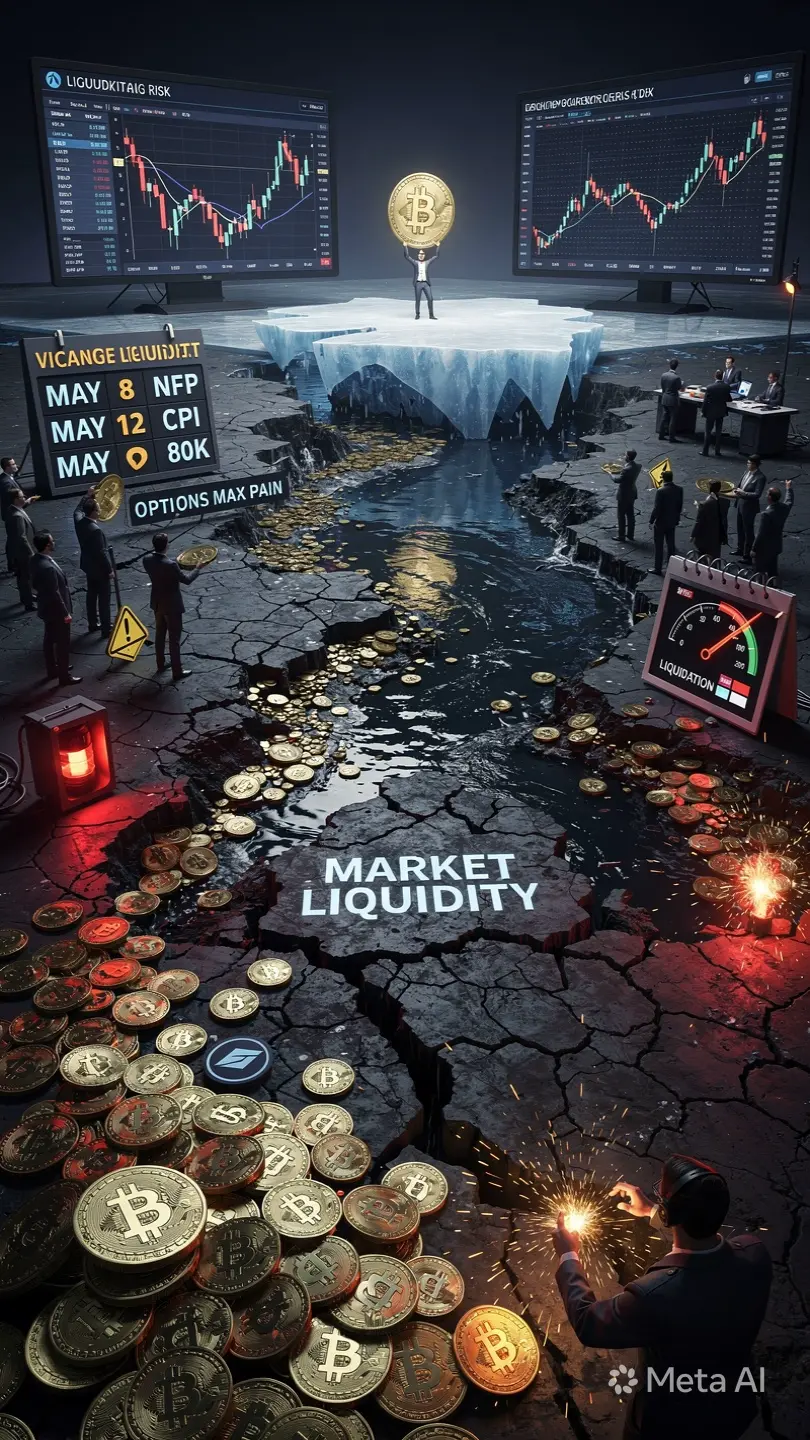
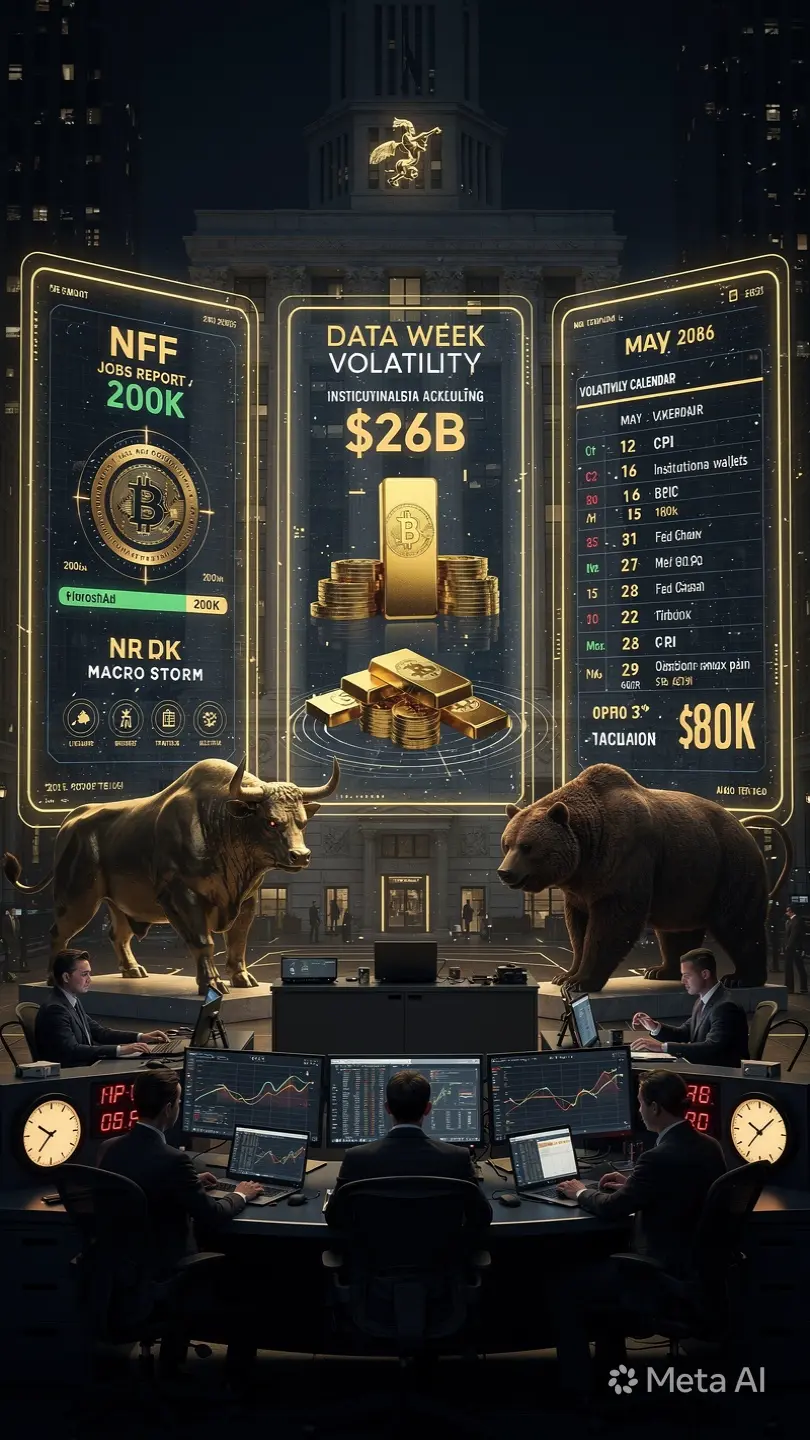
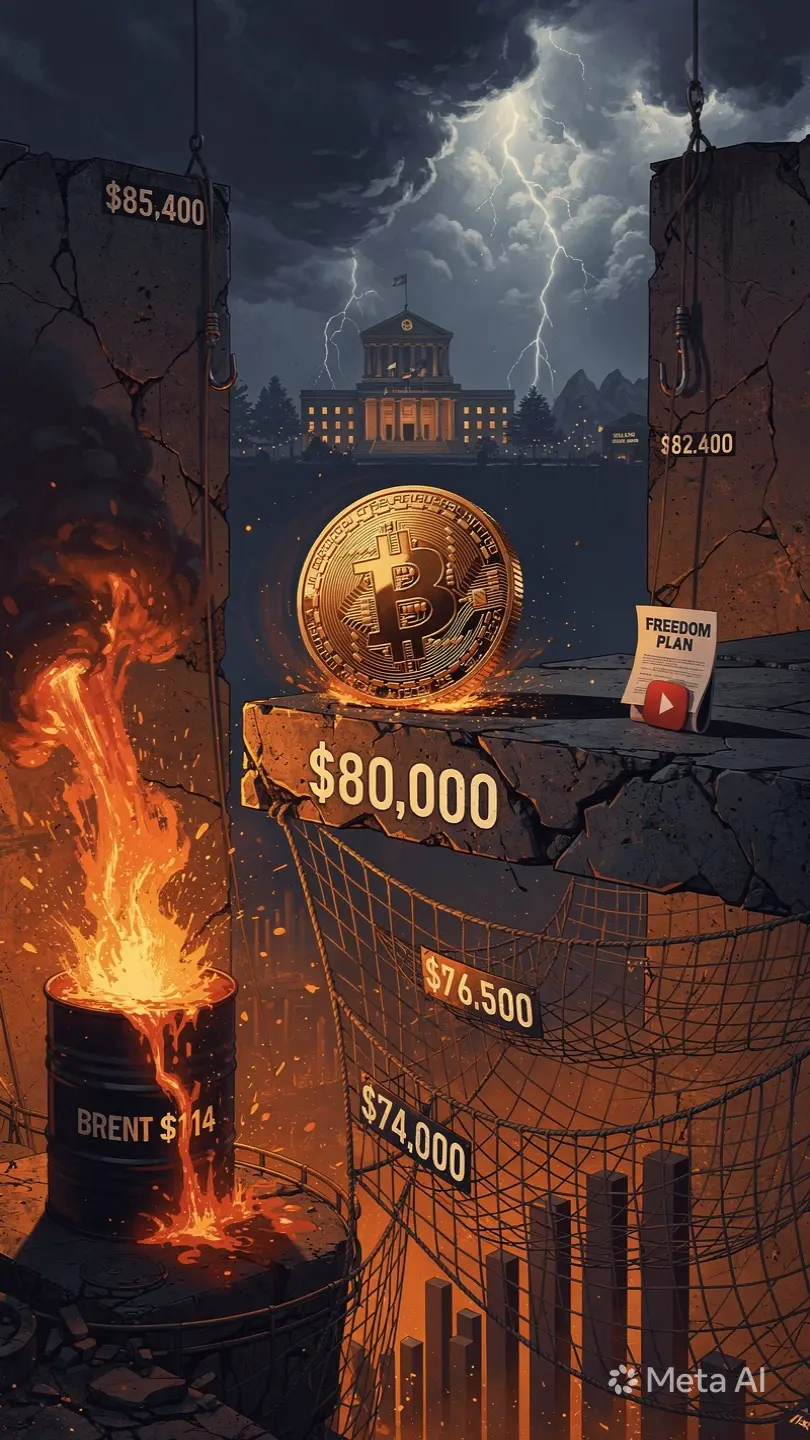
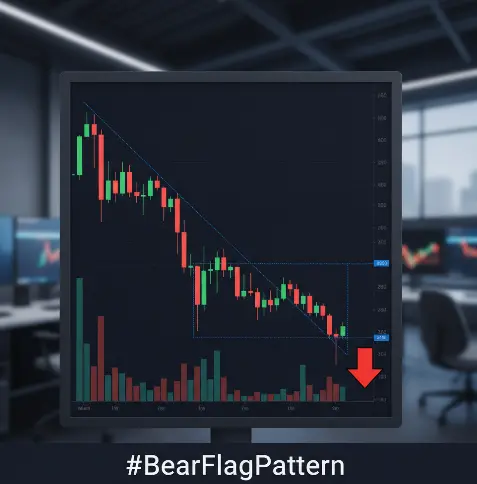
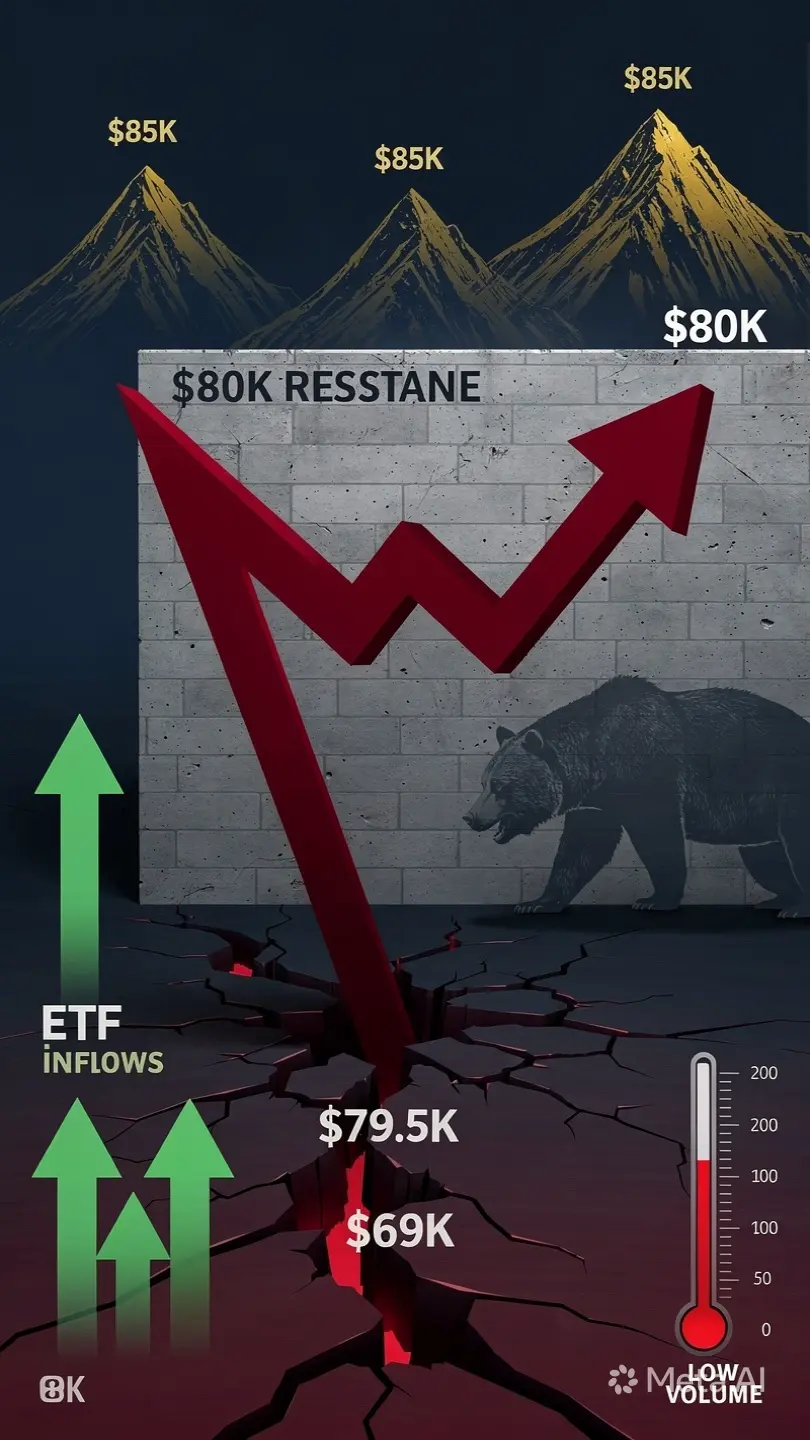
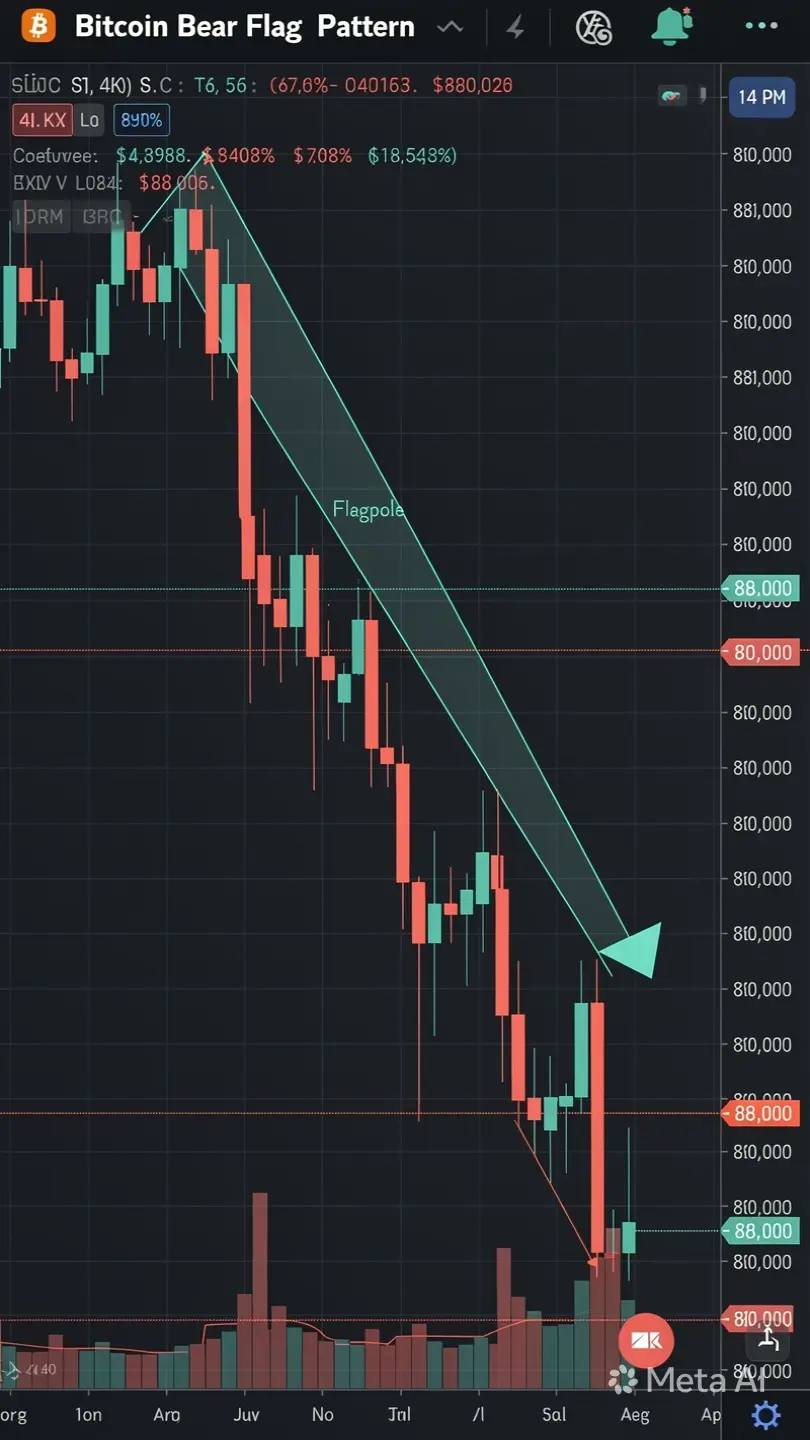
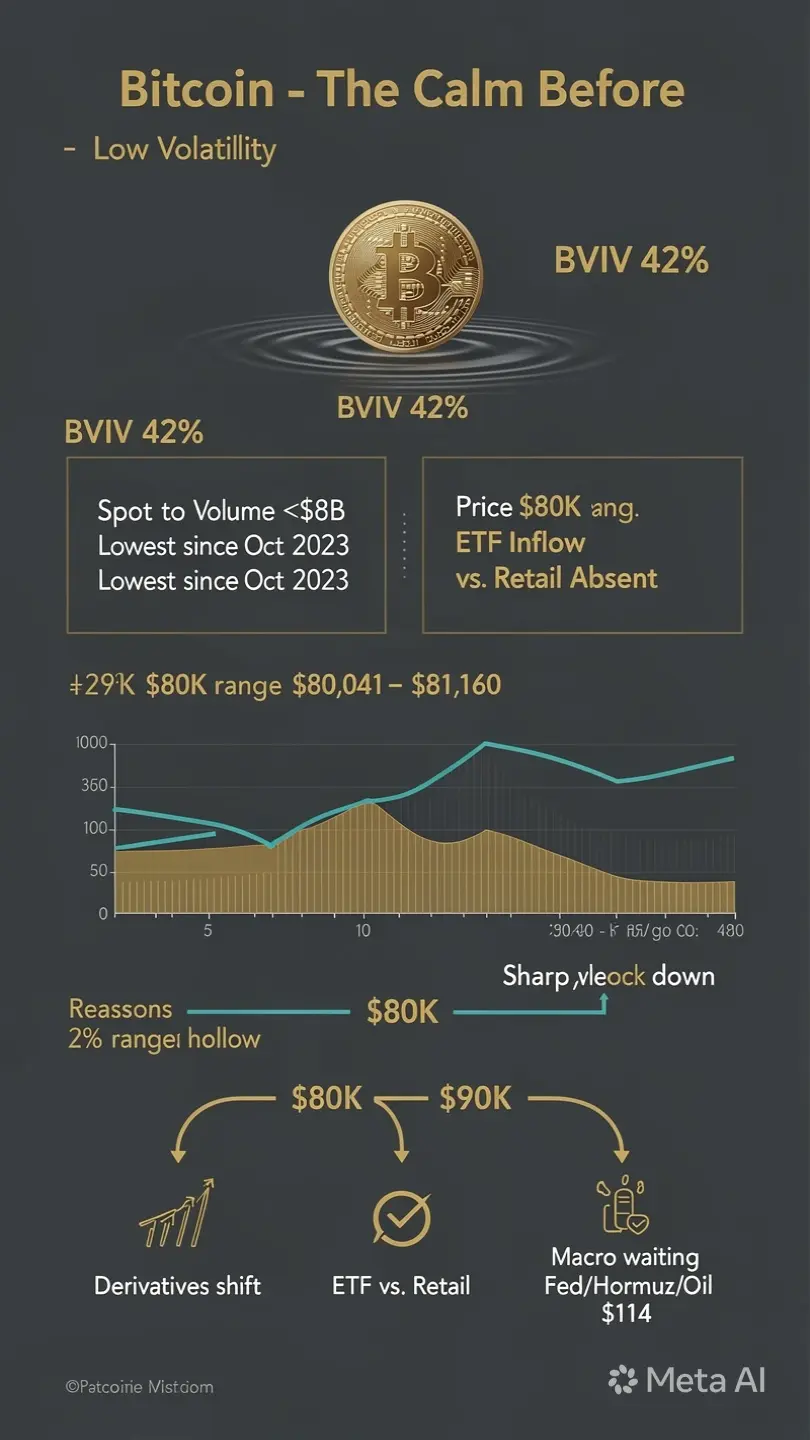
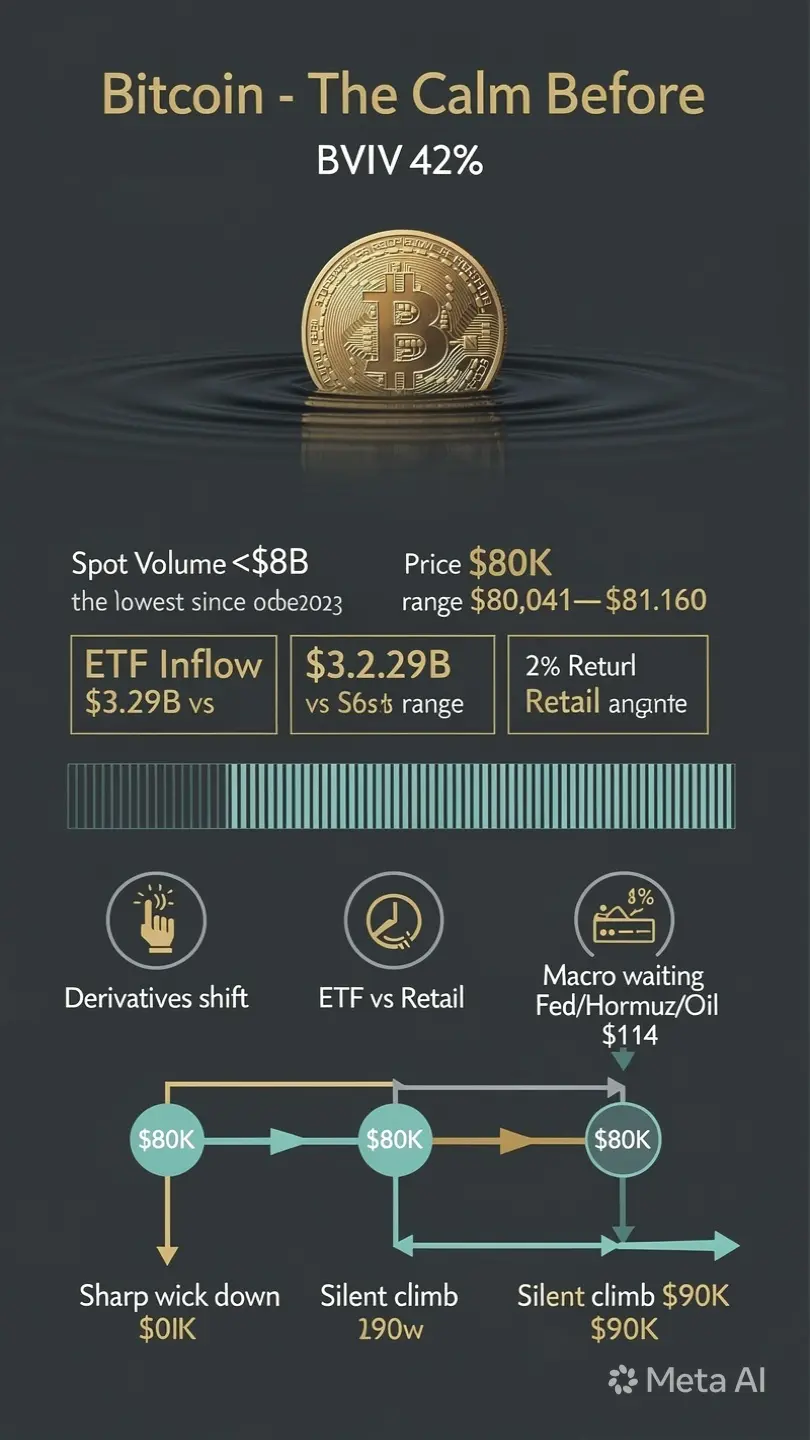
بيتكوين (81,270 دولارًا) حاليًا في مرحلة تجميع عالية المستوى، مما يعكس القوة بدلاً من الضعف، حيث يواصل اللاعبون المؤسساتيون التجميع بينما ينتظر المتداولون الأفراد التأكيد. الآن، يتأثر البيتكوين بشكل كبير بالعوامل الكلية مثل خفض أسعار الفيدرالي، بيانات مؤشر أسعار المستهلك، السيولة العالمية، تدفقات الصناديق المتداولة، وقوة الدولار الأمريكي. إذا توسعت السيولة وهدأت التضخم، يمكن للبيتكوين أن يدفع نحو 90 ألف دولار–100 ألف دولار، وحتى 110 ألف دولار، ولكن إذا تأخرت خفضات الفائدة وقوى الدولار زادت، فمن الممكن أن يتراجع نحو 75 ألف دولار–$68K . من الناحية الاستراتيجية، يشتري المتداولون الانخفاضات بالقرب من $78K وينتظرون اختراقًا مؤكدًا فوق 85 ألف دولار.
الذهب (4570 دولارًا) يظل أقوى ملاذ آمن، مدعومًا من قبل البنوك المركزية، والتحوط من التضخم، وعدم اليقين العالمي. على عكس البيتكوين، فهو مدفوع بالاستقرار ويؤدي بشكل أفضل خلال الضغوط الاقتصادية. إذا بدأت خفضات الفائدة وزادت المخاطر الجيوسياسية، يمكن للذهب أن يرتفع نحو 4800–5200 دولار، بينما قد يدفعه الدولار القوي مرة أخرى إلى 4300 دولار. تظل المؤسسات متفائلة، وتستخدم الذهب كحماية، ويفضل المتداولون استراتيجية الشراء عند الانخفاض بدلاً من ملاحقة القمم.
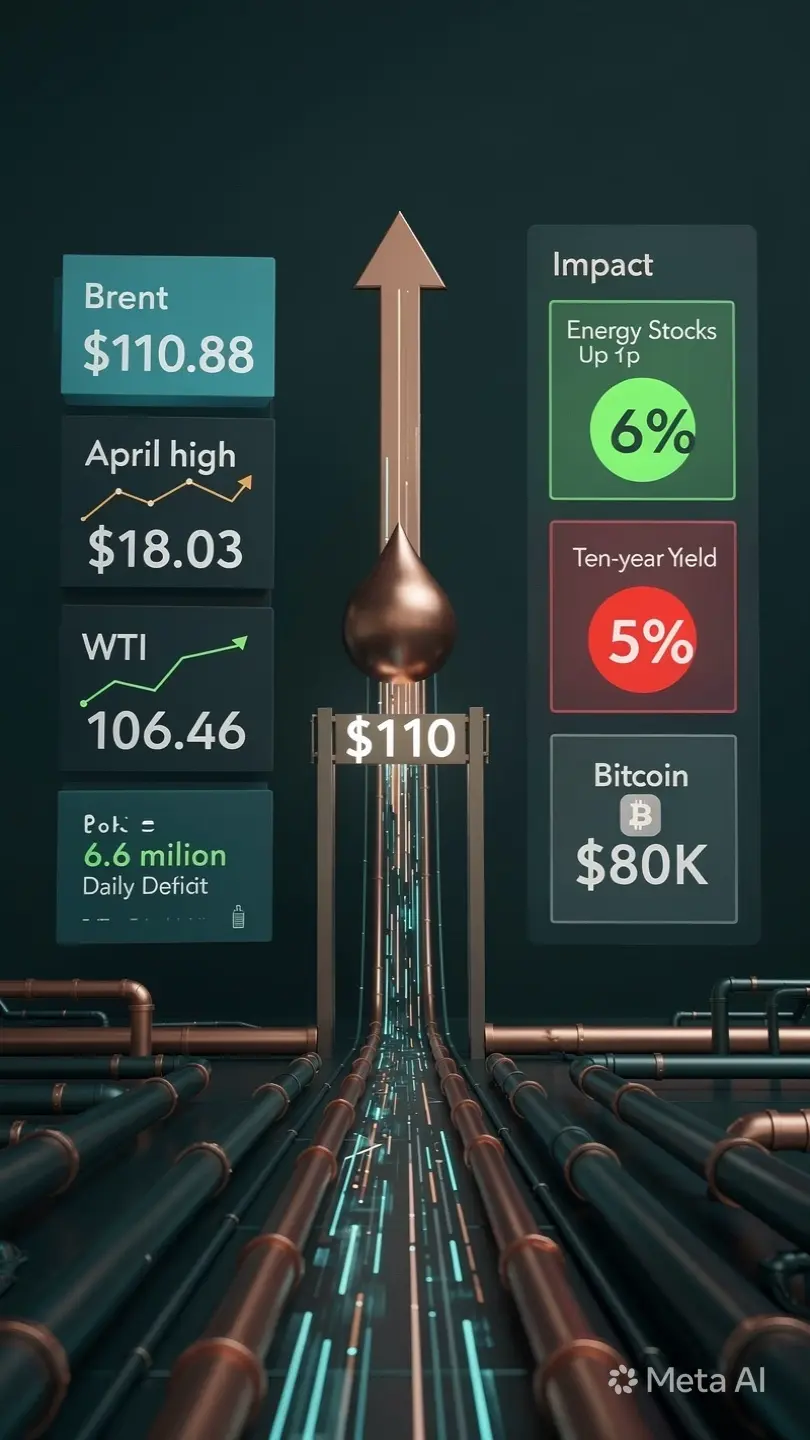
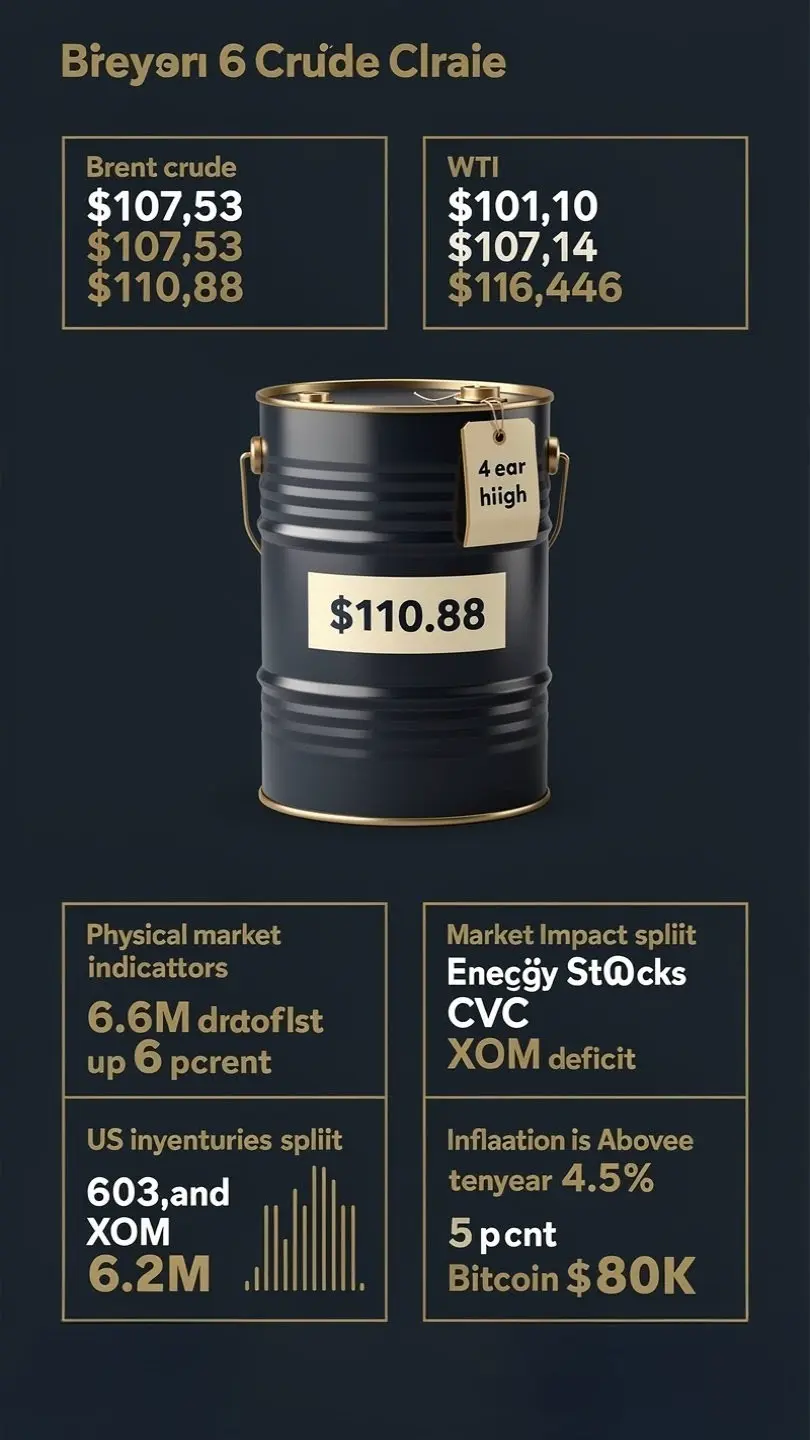
النفط (XTI 102.4 دولار) هو الأصول الأكثر تقلبًا وتوجيهًا جيوسياسيًا، يتأثر بالتوترات بين الولايات المتحدة وإيران، مخاطر مضيق هرمز، قرارات أوبك+ للإمدادات، والطلب العالمي. إذا زادت مخاوف اضطرابات الإمدادات، يمكن للنفط أن يقفز نحو 110–120 دولارًا، بينما يمكن أن يدفعه الاستقرار أو ضعف الطلب إلى 95–90 دولارًا. يركز المتداولون على التحركات قصيرة الأجل، باستخدام استراتيجيات التداول ضمن النطاق بين 98–106 دولار، وخطط الاختراق فوق 108 دولار.
مقارنةً بذلك، تقدم البيتكوين أعلى نمو ولكن مع تقلبات عالية، ويوفر الذهب الاستقرار والحماية على المدى الطويل، بينما يقدم النفط تحركات سريعة وغير متوقعة مدفوعة بالأحداث العالمية. لا يعتمد المتداولون الأذكياء على أصل واحد — بل يتكيفون مع الظروف الكلية، باستخدام البيتكوين للفرص، والذهب للأمان، والنفط للردود السريعة.
بيتكوين (81,270 دولارًا) حاليًا في مرحلة تجميع عالية المستوى، مما يعكس القوة بدلاً من الضعف، حيث يواصل اللاعبون المؤسساتيون التجميع بينما ينتظر المتداولون الأفراد التأكيد. الآن، يتأثر البيتكوين بشكل كبير بالعوامل الكلية مثل خفض أسعار الفيدرالي، بيانات مؤشر أسعار المستهلك، السيولة العالمية، تدفقات الصناديق المتداولة، وقوة الدولار الأمريكي. إذا توسعت السيولة وهدأت التضخم، يمكن للبيتكوين أن يدفع نحو 90 ألف دولار–100 ألف دولار، وحتى 110 ألف دولار، ولكن إذا تأخرت خفضات الفائدة وقوى الدولار زادت، فمن الممكن أن يتراجع نحو 75 ألف دولار–$68K . من الناحية الاستراتيجية، يشتري المتداولون الانخفاضات بالقرب من $78K وينتظرون اختراقًا مؤكدًا فوق 85 ألف دولار.
الذهب (4570 دولارًا) يظل أقوى ملاذ آمن، مدعومًا من قبل البنوك المركزية، والتحوط من التضخم، وعدم اليقين العالمي. على عكس البيتكوين، فهو مدفوع بالاستقرار ويؤدي بشكل أفضل خلال الضغوط الاقتصادية. إذا بدأت خفضات الفائدة وزادت المخاطر الجيوسياسية، يمكن للذهب أن يرتفع نحو 4800–5200 دولار، بينما قد يدفعه الدولار القوي مرة أخرى إلى 4300 دولار. تظل المؤسسات متفائلة، وتستخدم الذهب كحماية، ويفضل المتداولون استراتيجية الشراء عند الانخفاض بدلاً من ملاحقة القمم.
النفط (XTI 102.4 دولار) هو الأصول الأكثر تقلبًا وتوجيهًا جيوسياسيًا، يتأثر بالتوترات بين الولايات المتحدة وإيران، مخاطر مضيق هرمز، قرارات أوبك+ للإمدادات، والطلب العالمي. إذا زادت مخاوف اضطرابات الإمدادات، يمكن للنفط أن يقفز نحو 110–120 دولارًا، بينما يمكن أن يدفعه الاستقرار أو ضعف الطلب إلى 95–90 دولارًا. يركز المتداولون على التحركات قصيرة الأجل، باستخدام استراتيجيات التداول ضمن النطاق بين 98–106 دولار، وخطط الاختراق فوق 108 دولار.
مقارنةً بذلك، تقدم البيتكوين أعلى نمو ولكن مع تقلبات عالية، ويوفر الذهب الاستقرار والحماية على المدى الطويل، بينما يقدم النفط تحركات سريعة وغير متوقعة مدفوعة بالأحداث العالمية. لا يعتمد المتداولون الأذكياء على أصل واحد — بل يتكيفون مع الظروف الكلية، باستخدام البيتكوين للفرص، والذهب للأمان، والنفط للردود السريعة.

