Trade
Trading Type
Spot
Trade crypto freely
Alpha
Points
Get promising tokens in streamlined on-chain trading
Pre-Market
Trade new tokens before they are officially listed
Margin
Magnify your profit with leverage
Convert & Block Trading
0 Fees
Trade any size with no fees and no slippage
Leveraged Tokens
Get exposure to leveraged positions simply
Futures
Futures
Hundreds of contracts settled in USDT or BTC
Options
HOT
Trade European-style vanilla options
Unified Account
Maximize your capital efficiency
Demo Trading
Futures Kickoff
Get prepared for your futures trading
Futures Events
Participate in events to win generous rewards
Demo Trading
Use virtual funds to experience risk-free trading
Earn
Launch
Investment
Simple Earn
VIP
Earn interests with idle tokens
Auto-Invest
Auto-invest on a regular basis
Dual Investment
Buy low and sell high to take profits from price fluctuations
Quant Fund
VIP
Top asset management team helps you profit without hassle
Crypto Loan
0 Fees
Pledge one crypto to borrow another
Lending Center
One-Stop Lending Hub
VIP Wealth Hub
New
Customized wealth management empowers your assets growth
Staking
Stake cryptos to earn in PoS products
BTC Staking
HOT
Stake BTC and earn 10% APR
ETH Staking
HOT
Stake ETH and earn 10% APR
GUSD Minting
New
Use USDT/USDC to mint GUSD for treasury-level yields
Soft Staking
Earn rewards with flexible staking
More


- Trending TopicsView More
7.4K Popularity
4.7M Popularity
121.6K Popularity
77.8K Popularity
162.9K Popularity
- Pin
- 🍁 Golden Autumn, Big Prizes Await!
Gate Square Growth Points Lucky Draw Carnival Round 1️⃣ 3️⃣ Is Now Live!
🎁 Prize pool over $15,000+, iPhone 17 Pro Max, Gate exclusive Merch and more awaits you!
👉 Draw now: https://www.gate.com/activities/pointprize/?now_period=13&refUid=13129053
💡 How to earn more Growth Points for extra chances?
1️⃣ Go to [Square], tap the icon next to your avatar to enter [Community Center]
2️⃣ Complete daily tasks like posting, commenting, liking, and chatting to rack up points!
🍀 100% win rate — you’ll never walk away empty-handed. Try your luck today!
Details: ht - 💥 Gate Square Event: #Post0GWinUSDT# 💥
Post original content on Gate Square related to 0G or the ongoing campaigns (Earn, CandyDrop, or Contract Trading Competition) for a chance to share 200 USDT rewards!
📅 Event Period: Sept 25, 2025, 18:00 – Oct 2, 2025, 16:00 UTC
📌 Related Campaigns:
Earn: Enjoy stable earnings
👉 https://www.gate.com/announcements/article/47290
CandyDrop: Claim 0G rewards
👉 https://www.gate.com/announcements/article/47286
Contract Trading Competition: Trade to win prizes
👉 https://www.gate.com/announcements/article/47221
📌 How to Participate:
1️⃣ Post original cont - 🚀 #GateNewbieVillageEpisode2# ✖️ @独领风骚必暴富
💰 Share your first profit on Gate | 🎉 Recall your most unexpected gain | 🤝 Grow with the community
⏰ Event Date:Sept 24 04:00 – Sept 30 16:00 UTC+8
How to Join:
1️⃣ Follow Gate_Square + @独领风骚必暴富
2️⃣ Post on Gate Square with the hashtag #GateNewbieVillageEpisode2#
3️⃣ Share your first pot of gold or your most surprising profit on Gate—more detailed and interesting posts have a higher chance to win!
🎁 Rewards
3 lucky winners → Gate X RedBull Tumbler + $20 Futures Trial Voucher
If merchandise cannot be shipped, it will be replaced with a $30 Futures - 🚗 #GateSquareCommunityChallenge# Round 2 — Which coin is not listed on Gate Launchpad❓
Time to prove if you’re a true Gate veteran!
💰 Join the challenge — 5 lucky winners will share $50 in GT!
👉 How to participate:
1️⃣ Follow Gate_Square
2️⃣ Like this post
3️⃣ Comment with your answer
🗓️ Deadline: October 8, 2025, 24:00 (UTC+8) - 🥊 You’ve entered the Trading PK Arena, matching your opponent now...
One click to place an order and jump into the battle! Who will climb the leaderboard and claim the 👑?
Gate’s brand-new Indicators Radar feature is live! Here you can:
📈 Share your trades on the live candlestick chart to [Square] 👉️ https://www.gate.com/post
👀 Watch others’ trading moves in real time;
💬 Go head-to-head with fellow traders in the community!
Don’t just read—follow the tutorial below and get started 👇
📌 Note: This feature is available only on app version 7.20.5 or above.
Mastering Cryptocurrency Triangle Patterns for Effective Trading
The Excitement of Solana's Triangle Pattern
Crypto enthusiasts, let's dive into the fascinating world of Solana (SOL)! Currently trading at $207.4 with a 3.38% increase, SOL is presenting an intriguing scenario on the charts. A symmetrical triangle pattern is emerging on the 1-hour timeframe, signaling a potential significant move in either direction.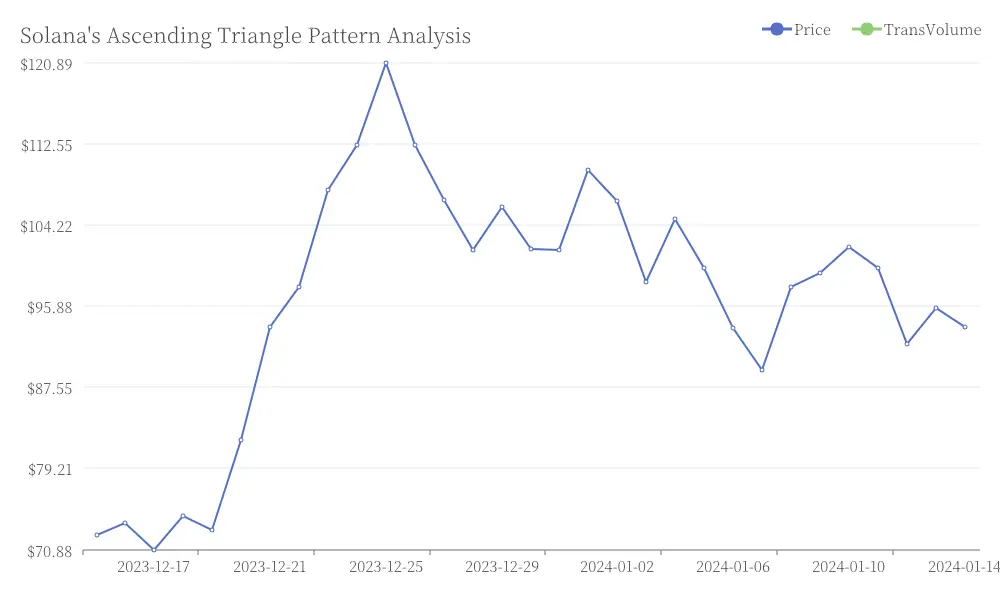 Solana Price Analysis: Symmetrical Triangle Pattern on 1-Hour Chart
Understanding the Triangle Formation
This triangle formation is crucial for traders to comprehend. It represents a battle between buyers and sellers, with the price consolidating within the pattern's boundaries. A breakout above the upper trendline could trigger a strong upward movement, while a breakdown below the lower trendline might lead to a short-term price decline.
Key Levels to Monitor
| Direction | Price Levels | |-----------|--------------| | Resistance | $212, $220, $230 | | Support | $200, $195, $185 |
Market Dynamics and Solana's Performance
The cryptocurrency market is heating up, with Solana emerging as one of the strongest performers among altcoins. Both institutional investors and retail traders are closely monitoring SOL's movements, anticipating rapid price action once the breakout occurs.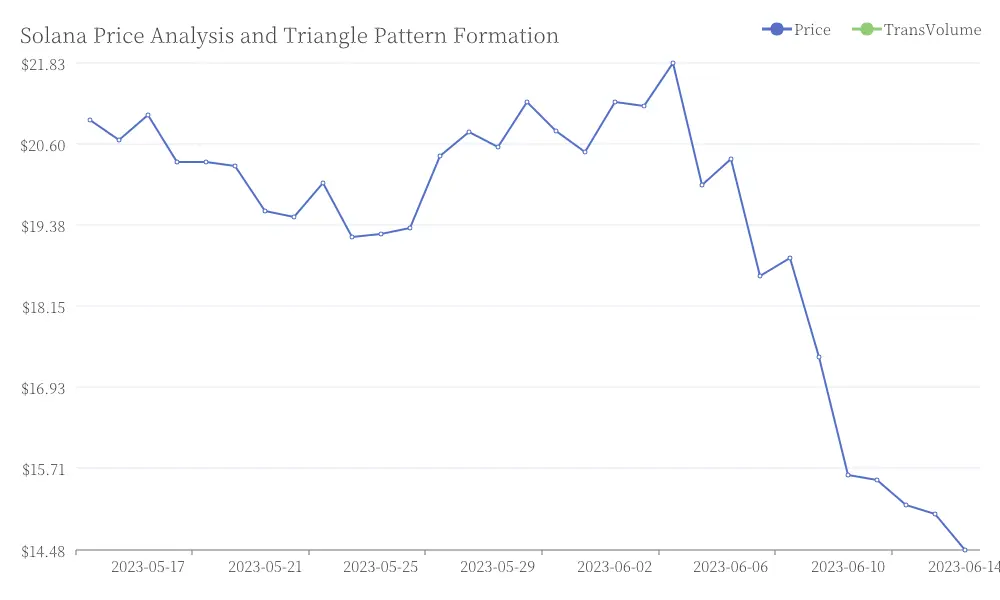 Solana Price Analysis and Triangle Pattern Formation
Trading Perspective and Potential Scenarios
From a trading standpoint, maintaining a position above $200 could indicate bullish control. A clear breach of the $212 level might signal the beginning of the next rally phase for Solana. Traders should remain vigilant and consider their risk management strategies when approaching this potentially volatile situation.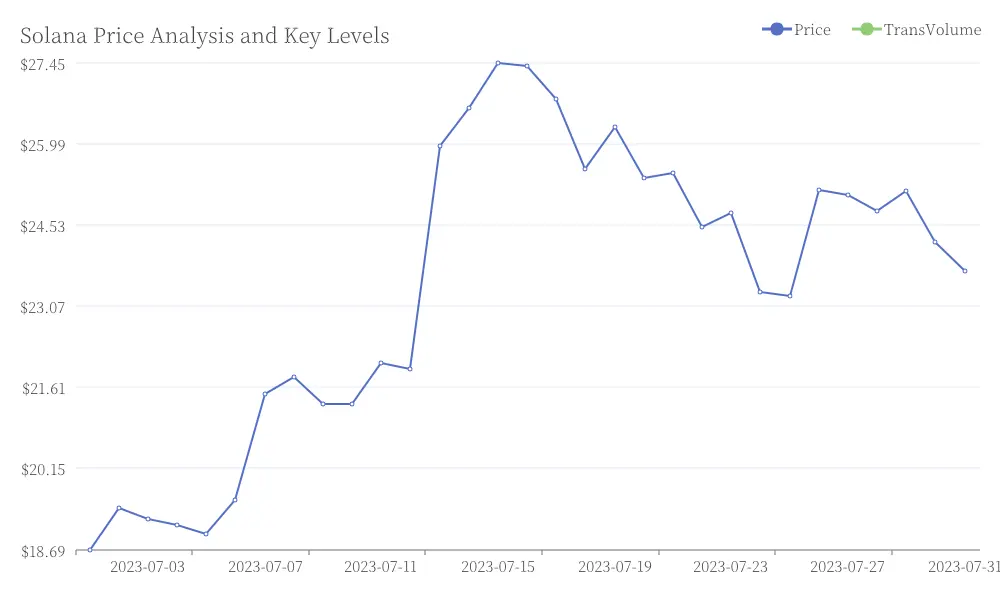 Solana Price Analysis and Key Levels
The Significance of Triangle Patterns in Crypto Trading
Triangle patterns serve as valuable tools for cryptocurrency traders, typically indicating a continuation of existing trends. Ascending triangles suggest bullish momentum, while symmetrical triangles point to consolidation periods before eventual breakouts. When combined with sound risk management practices, these patterns significantly enhance trading effectiveness in the volatile crypto marketplace.
Solana's Position in the Current Market
As one of the prominent players in the blockchain space, Solana's price movements attract significant attention. The current triangle formation adds an extra layer of excitement to SOL's market dynamics, potentially setting the stage for an eventful trading period ahead.