Trade
Trading Type
Spot
Trade crypto freely
Alpha
Points
Get promising tokens in streamlined on-chain trading
Pre-Market
Trade new tokens before they are officially listed
Margin
Magnify your profit with leverage
Convert & Block Trading
0 Fees
Trade any size with no fees and no slippage
Leveraged Tokens
Get exposure to leveraged positions simply
Futures
Futures
Hundreds of contracts settled in USDT or BTC
Options
HOT
Trade European-style vanilla options
Unified Account
Maximize your capital efficiency
Demo Trading
Futures Kickoff
Get prepared for your futures trading
Futures Events
Participate in events to win generous rewards
Demo Trading
Use virtual funds to experience risk-free trading
Earn
Launch
Investment
Simple Earn
VIP
Earn interests with idle tokens
Auto-Invest
Auto-invest on a regular basis
Dual Investment
Buy low and sell high to take profits from price fluctuations
Quant Fund
VIP
Top asset management team helps you profit without hassle
Crypto Loan
0 Fees
Pledge one crypto to borrow another
Lending Center
One-Stop Lending Hub
VIP Wealth Hub
New
Customized wealth management empowers your assets growth
Staking
Stake cryptos to earn in PoS products
BTC Staking
HOT
Stake BTC and earn 10% APR
ETH Staking
HOT
Stake ETH and earn 10% APR
GUSD Minting
New
Use USDT/USDC to mint GUSD for treasury-level yields
Soft Staking
Earn rewards with flexible staking
More


- Trending TopicsView More
1.4K Popularity
4.7M Popularity
119.4K Popularity
77.5K Popularity
162.8K Popularity
- Pin
- 🍁 Golden Autumn, Big Prizes Await!
Gate Square Growth Points Lucky Draw Carnival Round 1️⃣ 3️⃣ Is Now Live!
🎁 Prize pool over $15,000+, iPhone 17 Pro Max, Gate exclusive Merch and more awaits you!
👉 Draw now: https://www.gate.com/activities/pointprize/?now_period=13&refUid=13129053
💡 How to earn more Growth Points for extra chances?
1️⃣ Go to [Square], tap the icon next to your avatar to enter [Community Center]
2️⃣ Complete daily tasks like posting, commenting, liking, and chatting to rack up points!
🍀 100% win rate — you’ll never walk away empty-handed. Try your luck today!
Details: ht - 💥 Gate Square Event: #Post0GWinUSDT# 💥
Post original content on Gate Square related to 0G or the ongoing campaigns (Earn, CandyDrop, or Contract Trading Competition) for a chance to share 200 USDT rewards!
📅 Event Period: Sept 25, 2025, 18:00 – Oct 2, 2025, 16:00 UTC
📌 Related Campaigns:
Earn: Enjoy stable earnings
👉 https://www.gate.com/announcements/article/47290
CandyDrop: Claim 0G rewards
👉 https://www.gate.com/announcements/article/47286
Contract Trading Competition: Trade to win prizes
👉 https://www.gate.com/announcements/article/47221
📌 How to Participate:
1️⃣ Post original cont - 🚀 #GateNewbieVillageEpisode2# ✖️ @独领风骚必暴富
💰 Share your first profit on Gate | 🎉 Recall your most unexpected gain | 🤝 Grow with the community
⏰ Event Date:Sept 24 04:00 – Sept 30 16:00 UTC+8
How to Join:
1️⃣ Follow Gate_Square + @独领风骚必暴富
2️⃣ Post on Gate Square with the hashtag #GateNewbieVillageEpisode2#
3️⃣ Share your first pot of gold or your most surprising profit on Gate—more detailed and interesting posts have a higher chance to win!
🎁 Rewards
3 lucky winners → Gate X RedBull Tumbler + $20 Futures Trial Voucher
If merchandise cannot be shipped, it will be replaced with a $30 Futures - 🚗 #GateSquareCommunityChallenge# Round 2 — Which coin is not listed on Gate Launchpad❓
Time to prove if you’re a true Gate veteran!
💰 Join the challenge — 5 lucky winners will share $50 in GT!
👉 How to participate:
1️⃣ Follow Gate_Square
2️⃣ Like this post
3️⃣ Comment with your answer
🗓️ Deadline: October 8, 2025, 24:00 (UTC+8) - 🥊 You’ve entered the Trading PK Arena, matching your opponent now...
One click to place an order and jump into the battle! Who will climb the leaderboard and claim the 👑?
Gate’s brand-new Indicators Radar feature is live! Here you can:
📈 Share your trades on the live candlestick chart to [Square] 👉️ https://www.gate.com/post
👀 Watch others’ trading moves in real time;
💬 Go head-to-head with fellow traders in the community!
Don’t just read—follow the tutorial below and get started 👇
📌 Note: This feature is available only on app version 7.20.5 or above.
Days Calculator: Count from Any Date
###Cryptocurrency Market Cycle Analysis: Potential Peak Approaching
As of September 20, 2025, the cryptocurrency market cycle has progressed significantly since the November 2022 low. With 1,244 days elapsed, we are approaching the historical peak window of 1,060-1,100 days observed in previous cycles. This positions the potential cycle peak in the coming weeks.
###Halving Event and Market Dynamics
The last halving event occurred 891 days ago in April 2024. Historical data suggests market peaks typically arrive 518-580 days post-halving. We are currently well within this timeframe, indicating a critical phase in the market cycle.
###Current Market Conditions
The market is experiencing a typical third-quarter consolidation period. September has historically been the weakest month, with an average decline of 6.17%. However, this often precedes strength in October and November.
###Technical Analysis
|Metric|Value| |---|---| |Current Price|$109,800| |All-Time High|$124,100 (August 14, 2025)| |50-week Simple Moving Average|$95,900| |200-week Simple Moving Average|$52,300| |7-week Correlation with S&P 500|-0.25|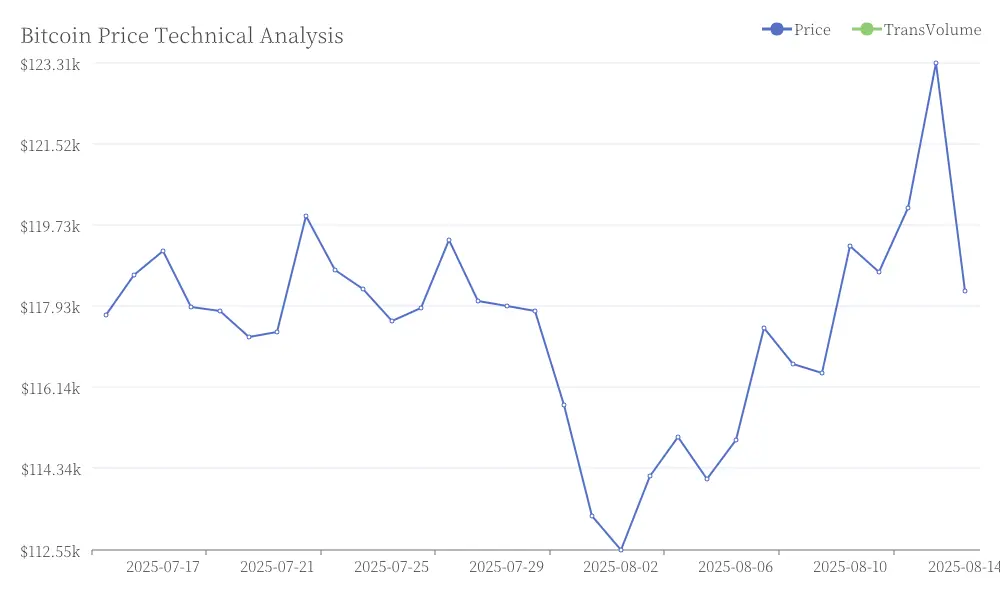 Bitcoin Price Technical Analysis
The negative correlation with traditional markets suggests a potential decoupling, often indicative of significant market movements.
###Short-Term Market Indicators
|Indicator|Value| |---|---| |200-day Breakout Pro|$111,000| |200-day Simple Moving Average|$101,500| |Relative Strength Index|43| |Average True Range|3,000| |50-day Volatility|2,940| |Local Support Range|$107,700 - $108,700| |Local Resistance Range|$113,000 - $114,100|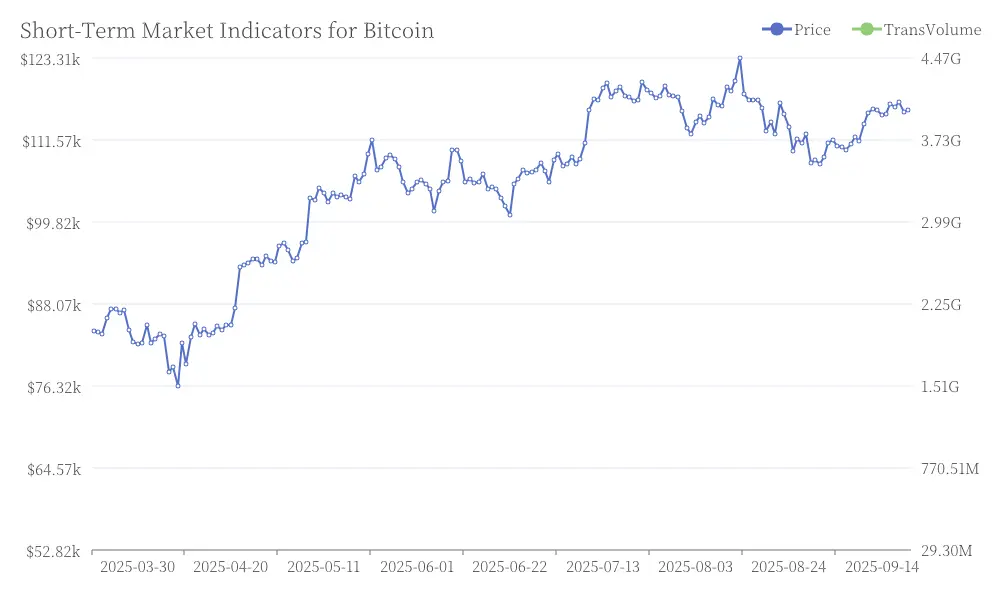 Short-Term Market Indicators for Bitcoin
###Market Direction and Risk Assessment
The market structure remains bearish below $112,758, with increased downside risk if prices fall below the $107,000-$108,000 range. Secondary corrections typically result in 20-30% dips.
###On-Chain Metrics and Mining Activity
|Metric|Value| |---|---| |Mining Cost|$95,400| |Cost to Price Ratio|0.86| |Net Unrealized Profit/Loss|0.527| |Market Value to Realized Value|2.20| |Percentage of Supply in Profit|>90%|
These metrics suggest a healthy mining ecosystem with low capitulation risk.
###Institutional Involvement
Recent data shows a 24-hour spot volume of $630.94 million for cryptocurrency investment products. After August outflows, September 3rd saw a positive net flow of $332.8 million. Total assets under management for these products stand at $155.8 billion, with spot products representing 93.54% of market share.
###Market Outlook
The cryptocurrency market appears to be in the final stages of its current cycle, with approximately 50 days remaining until the historical peak window. Key support levels have held, and on-chain metrics remain resilient. However, caution is advised as volatility may increase in the coming weeks.
Investors should be prepared for potential significant price movements in October and November, which could mark the cycle peak and possibly lead to an altcoin season. As always, thorough research and risk management are crucial when participating in the cryptocurrency market.