Trade
Trading Type
Spot
Trade crypto freely
Alpha
Points
Get promising tokens in streamlined on-chain trading
Pre-Market
Trade new tokens before they are officially listed
Margin
Magnify your profit with leverage
Convert & Block Trading
0 Fees
Trade any size with no fees and no slippage
Leveraged Tokens
Get exposure to leveraged positions simply
Futures
Futures
Hundreds of contracts settled in USDT or BTC
Options
HOT
Trade European-style vanilla options
Unified Account
Maximize your capital efficiency
Demo Trading
Futures Kickoff
Get prepared for your futures trading
Futures Events
Participate in events to win generous rewards
Demo Trading
Use virtual funds to experience risk-free trading
Earn
Launch
Investment
Simple Earn
VIP
Earn interests with idle tokens
Auto-Invest
Auto-invest on a regular basis
Dual Investment
Buy low and sell high to take profits from price fluctuations
Quant Fund
VIP
Top asset management team helps you profit without hassle
Crypto Loan
0 Fees
Pledge one crypto to borrow another
Lending Center
One-Stop Lending Hub
VIP Wealth Hub
New
Customized wealth management empowers your assets growth
Staking
Stake cryptos to earn in PoS products
BTC Staking
HOT
Stake BTC and earn 10% APR
ETH Staking
HOT
Stake ETH and earn 10% APR
GUSD Minting
New
Use USDT/USDC to mint GUSD for treasury-level yields
Soft Staking
Earn rewards with flexible staking
More


- Trending TopicsView More
14.3K Popularity
4.7M Popularity
124.2K Popularity
79.4K Popularity
164.7K Popularity
- Pin
- 🍁 Golden Autumn, Big Prizes Await!
Gate Square Growth Points Lucky Draw Carnival Round 1️⃣ 3️⃣ Is Now Live!
🎁 Prize pool over $15,000+, iPhone 17 Pro Max, Gate exclusive Merch and more awaits you!
👉 Draw now: https://www.gate.com/activities/pointprize/?now_period=13&refUid=13129053
💡 How to earn more Growth Points for extra chances?
1️⃣ Go to [Square], tap the icon next to your avatar to enter [Community Center]
2️⃣ Complete daily tasks like posting, commenting, liking, and chatting to rack up points!
🍀 100% win rate — you’ll never walk away empty-handed. Try your luck today!
Details: ht - 💥 Gate Square Event: #Post0GWinUSDT# 💥
Post original content on Gate Square related to 0G or the ongoing campaigns (Earn, CandyDrop, or Contract Trading Competition) for a chance to share 200 USDT rewards!
📅 Event Period: Sept 25, 2025, 18:00 – Oct 2, 2025, 16:00 UTC
📌 Related Campaigns:
Earn: Enjoy stable earnings
👉 https://www.gate.com/announcements/article/47290
CandyDrop: Claim 0G rewards
👉 https://www.gate.com/announcements/article/47286
Contract Trading Competition: Trade to win prizes
👉 https://www.gate.com/announcements/article/47221
📌 How to Participate:
1️⃣ Post original cont - 🚀 #GateNewbieVillageEpisode2# ✖️ @独领风骚必暴富
💰 Share your first profit on Gate | 🎉 Recall your most unexpected gain | 🤝 Grow with the community
⏰ Event Date:Sept 24 04:00 – Sept 30 16:00 UTC+8
How to Join:
1️⃣ Follow Gate_Square + @独领风骚必暴富
2️⃣ Post on Gate Square with the hashtag #GateNewbieVillageEpisode2#
3️⃣ Share your first pot of gold or your most surprising profit on Gate—more detailed and interesting posts have a higher chance to win!
🎁 Rewards
3 lucky winners → Gate X RedBull Tumbler + $20 Futures Trial Voucher
If merchandise cannot be shipped, it will be replaced with a $30 Futures - 🚗 #GateSquareCommunityChallenge# Round 2 — Which coin is not listed on Gate Launchpad❓
Time to prove if you’re a true Gate veteran!
💰 Join the challenge — 5 lucky winners will share $50 in GT!
👉 How to participate:
1️⃣ Follow Gate_Square
2️⃣ Like this post
3️⃣ Comment with your answer
🗓️ Deadline: October 8, 2025, 24:00 (UTC+8) - 🥊 You’ve entered the Trading PK Arena, matching your opponent now...
One click to place an order and jump into the battle! Who will climb the leaderboard and claim the 👑?
Gate’s brand-new Indicators Radar feature is live! Here you can:
📈 Share your trades on the live candlestick chart to [Square] 👉️ https://www.gate.com/post
👀 Watch others’ trading moves in real time;
💬 Go head-to-head with fellow traders in the community!
Don’t just read—follow the tutorial below and get started 👇
📌 Note: This feature is available only on app version 7.20.5 or above.
Cryptoassets Chart Patterns: Predicting Market Trends with Triangles
SOL is surging! Will it reach the big milestone of 240 Dollars or collapse to 175 Dollars? An important phase indicated by the ascending triangle.
The ascending triangle pattern is one of the most reliable chart patterns for cryptocurrency traders. SOL formed a sharp ascending triangle during the rebound process from 175 Dollar to 220 Dollar, with the lows gradually rising while the highs were capped around 220 Dollar. This pattern can spring up sharply if it breaks above the upper side (220 Dollar) or plummet if it falls below the lower side (196 Dollar). There is no middle ground.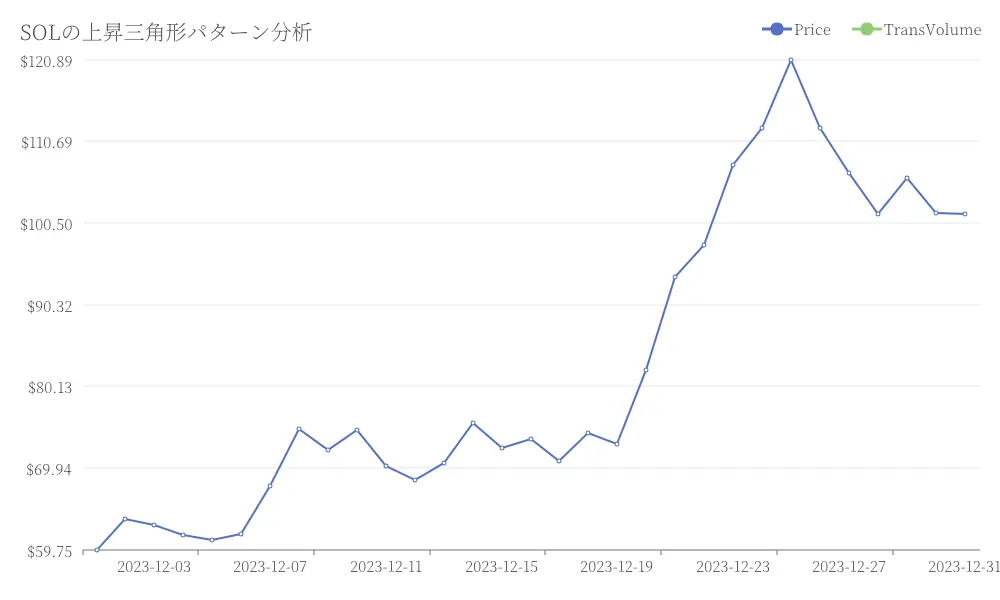 Analysis of the SOL rise triangle pattern
Breaking through 220 Dollar, 240 Dollar is in sight
$220 is not just a resistance line, but a "challenge" that SOL has failed to break through three times in the past month. There are also profit-taking sales from investors who bought at past highs. However, if the daily closing price exceeds $220 and the trading volume increases by 30% compared to the previous day, the door to a rise will open. After breaking through $220, the first target will be $235, where the resistance is relatively weak as it is the upper limit of the past range. Furthermore, if it easily surpasses $235, market sentiment will be completely ignited, and follow-up funds will flood in, making it highly likely to reach $240 within 48 hours, with further upside also expected.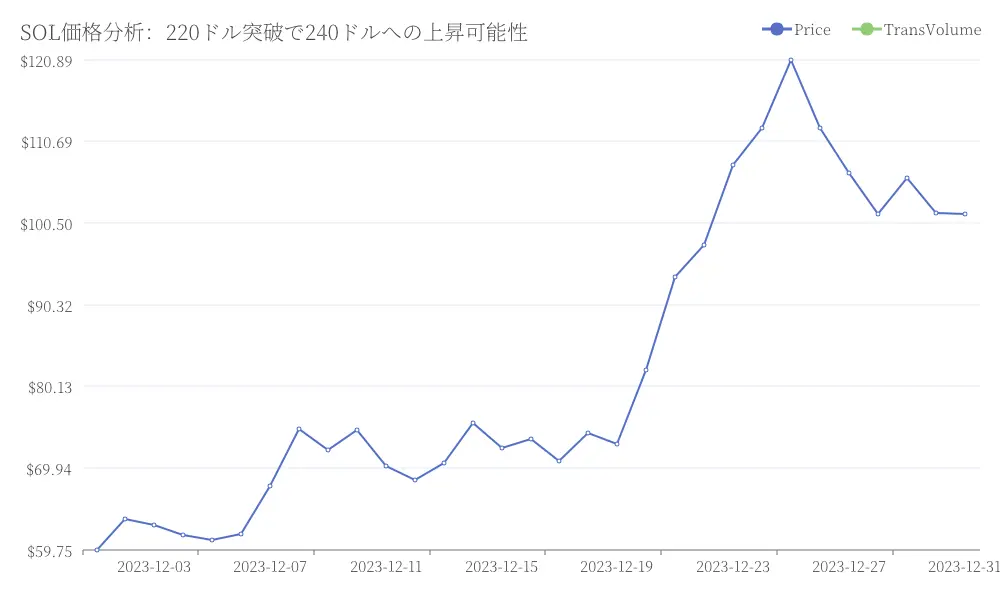 SOL price analysis: Possibility of rise to 240 Dollar after breaking 220 Dollar
The risk of falling to 175 Dollars below 196 Dollars
If it strongly bounces back at the resistance line of 220 Dollars, 196 Dollars will be the first and most important defense line. This 196 Dollars is the "lower support" of the rising triangle and also the recent low of the adjustment. If it breaks below this level, the pattern will collapse, and buying forces on the technical side may rush to cut losses, potentially causing a sharp drop in price. The next support is at 175 Dollars, which is the starting point of this rebound. If this level is also breached, there is a possibility of returning to the 160-170 Dollars range, which could nullify all the previous gains.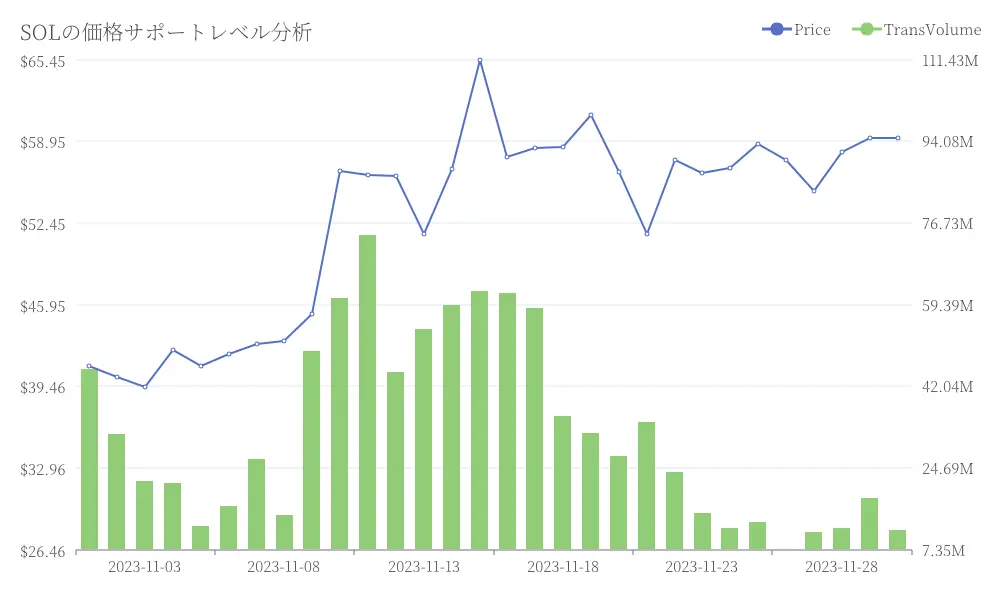 Analysis of SOL price support levels
The Breakout Signal Indicated by RSI and Price Trends
The current 6-hour RSI for SOL is around 58, which has not reached the overbought level (above 70), and no divergence is observed. This suggests that the current rise has not yet "exhausted its momentum," and if it breaks through resistance, there is further room for the RSI to rise.
Looking at the price trend, the recent adjustment has seen a decrease in trading volume, while there has been an increase in volume during the challenge towards 220 Dollar. This pattern of "decreasing adjustment, increasing rise" is itself a bullish signal and can be said to be in a state of waiting for "confirmation of the breakout."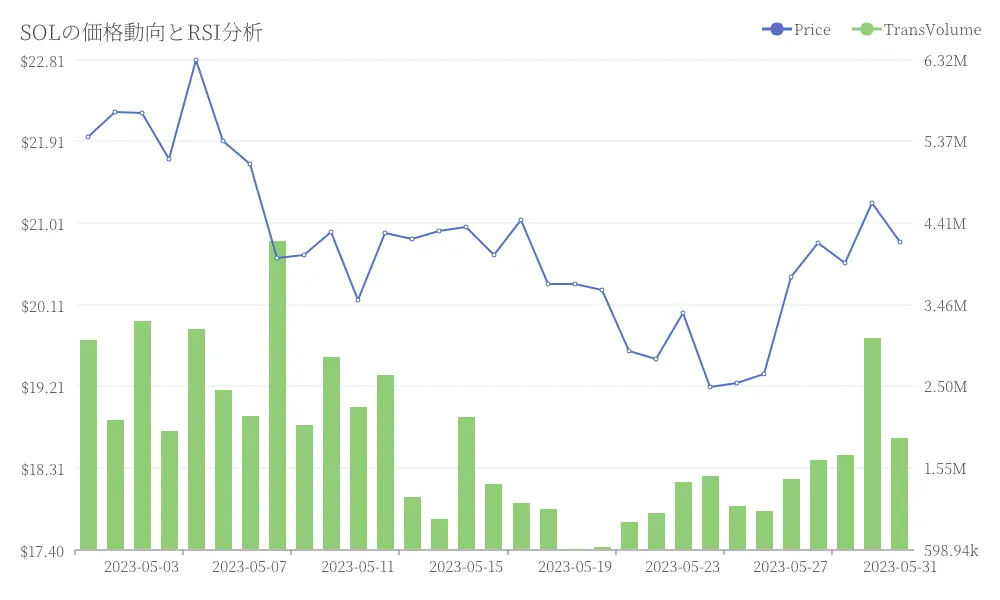 SOL price trends and RSI analysis
Trading Strategy: Seize Opportunities and Avoid Risks in Two Scenarios
In the rising scenario, you should actively buy when breaking through 220 Dollars. Enter immediately if the price breaks above 220 Dollars and does not return within 30 minutes, with a trading volume increase of 50% compared to the previous candle. Set the stop loss below 215 Dollars, and if this is breached, do not maintain the position due to the possibility of a "fake breakout." Take profits in two stages: realize 50% profit at 235 Dollars and aim for the remaining 50% at 240 Dollars. Once the target is reached, it is important to secure profits even if there is a potential for further rises.
In a downtrend scenario, we will carefully consider selling if the price falls below 196 Dollars. We will enter if the price drops below 196 Dollars, the hourly close is confirmed below that level, and the volume is double the usual amount. The stop loss will be set above 202 Dollars, and we will be cautious of "false sell signals." The take profit will be set at 185 Dollars as the first target and 175 Dollars as the second target. It is crucial to close the position once we reach 175 Dollars and not to be greedy while expecting further declines, as 175 Dollars is a strong support level and tends to rebound easily.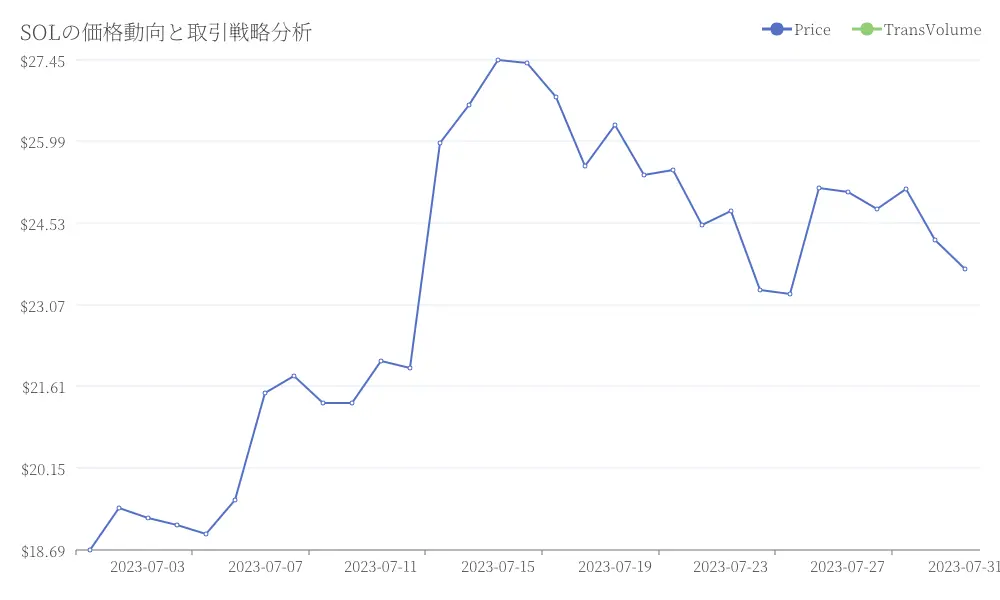 Analysis of SOL price trends and trading strategies