Peter Brandt, a chart analysis expert in the futures market with experience since 1975, predicts breakthrough increases for the two leading altcoins Solana (SOL) and Ripple’s XRP. He has initiated a discussion with a community of over 1 million followers on Twitter, seeking opinions on altcoin choices for a 100,000 USD investment.
Currently, Solana and XRP have market capitalizations of 137 billion USD and 92 billion USD, respectively. XRP has recorded an increase of 12.34% since the beginning of the year, while Solana has decreased by more than 7%. However, in the last 90 days, Solana has made a strong recovery with a rise of 25%, while XRP has only slightly increased by 1.46%.
Solana approaches the breakout point of the round bottom pattern
Solana is currently trading around 177 USD, up 20% this month after an 18% bounce in April. The price action forms a U shape, creating a rounded bottom pattern with the neckline near the supply level of 180 USD.
Based on the Fibonacci levels extended from 261 USD to 105 USD ( from 1/18 to 4/8/), the support zone is near the 50% level at 183 USD. Therefore, if the price closes above 183 USD on the daily chart, it could mark the beginning of the next bullish trend for Solana. The estimated breakout target is around 257 USD, close to the 78.6% Fibonacci level at 262 USD.
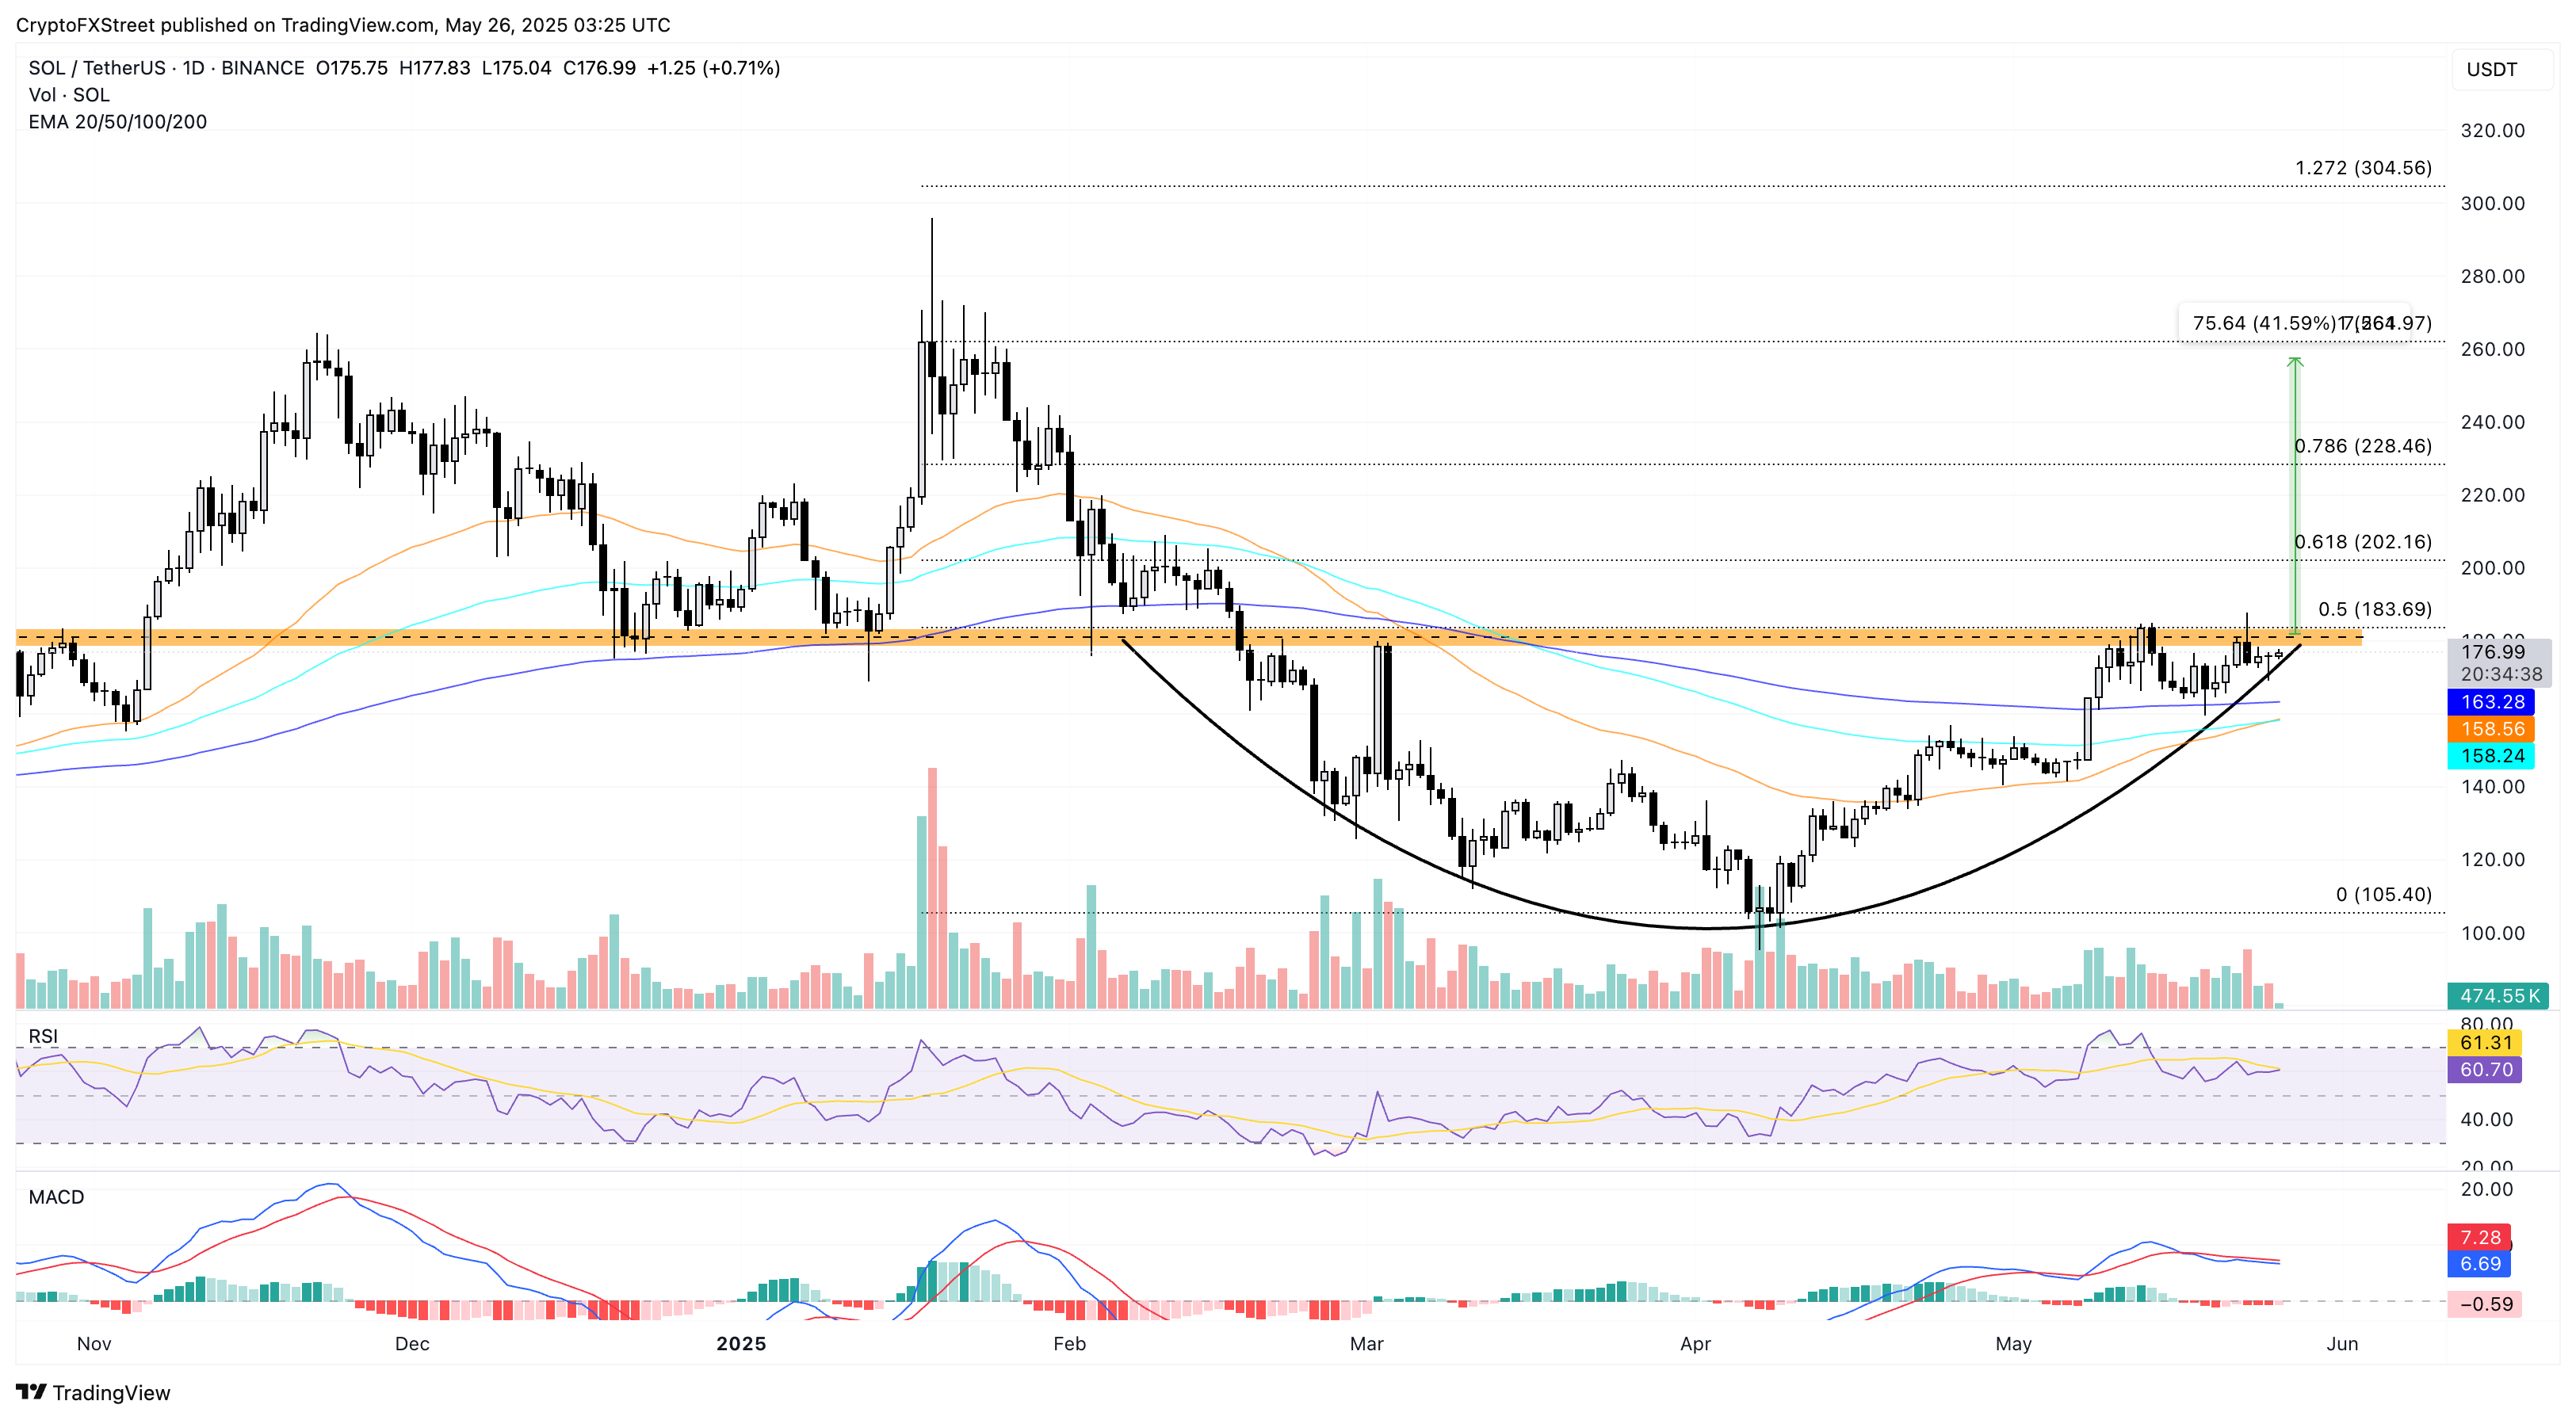 The daily price chart of SOL/USDT. Source: TradingviewThe 50-day and 100-day EMA moving averages create a golden cross, supporting the potential trend reversal. Momentum indicators like RSI maintain around 60 and MACD with the signal line close together, indicating untapped growth potential.
If Solana fails to close above 183 USD, the price may retest the 200-day EMA around 163 USD.
XRP aims for a 90% increase, reaching 4.43 USD
XRP started the trading week positively at 2.34 USD, up slightly by 0.17%. At the end of last week, the price formed a long Doji candle, trading above the 50 and 100-day EMAs.
XRP is forming a large symmetrical triangle with three peaks and two troughs since the beginning of 2025, predicting that a positive uptrend cycle will begin.
 Daily price chart of XRP/USDT. Source: TradingviewThe RSI index has decreased from the overbought zone to level 50, indicating that momentum is weakening. MACD and the signal line also intersected downwards on May 19.
The price of XRP is approaching the peak of the triangle, an uncertain area until there is a clear close on either side. If the price closes above the upper trend line around 2.50 USD, the next resistance levels are 2.58 USD, 2.93 USD, and 3.29 USD.
It is expected that if it breaks the triangle on the 3-day chart, XRP will enter a strong upward trend with a target of 4.43 USD, based on the short-term triangle pattern on the daily chart.
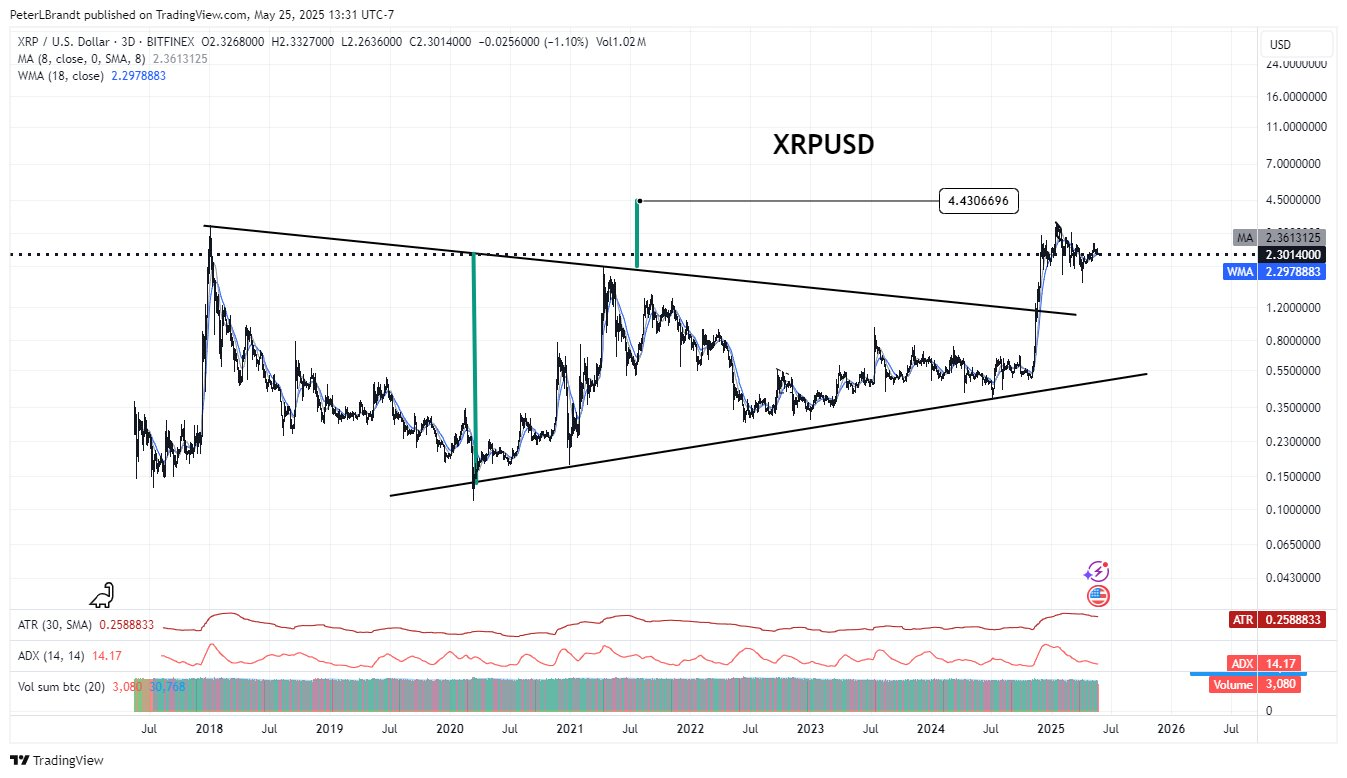
Conversely, closing below the support line around the 100-day EMA at 2.27 USD could pull the price down to 2.13 USD or lower at 1.79 USD.
Thạch Sanh
Disclaimer: The information on this page may come from third parties and does not represent the views or opinions of Gate. The content displayed on this page is for reference only and does not constitute any financial, investment, or legal advice. Gate does not guarantee the accuracy or completeness of the information and shall not be liable for any losses arising from the use of this information. Virtual asset investments carry high risks and are subject to significant price volatility. You may lose all of your invested principal. Please fully understand the relevant risks and make prudent decisions based on your own financial situation and risk tolerance. For details, please refer to
Disclaimer.
