 Bitcoin (BTC) is showing signs of tension as it clings to the support level of $65,000, raising concerns across the market.
As volatility recurs and momentum indicators signal caution, traders are questioning the nature of the current trend. Is this just a healthy pullback or could it mark the beginning of a broader capital movement?
As BTC consolidates, many analysts are discussing the possibility of an altcoin season occurring at the end of the year.
Bitcoin: Why is $65,000 an important milestone?
The $65,000 level of Bitcoin is emerging as an important support zone, with key metrics indicating caution.
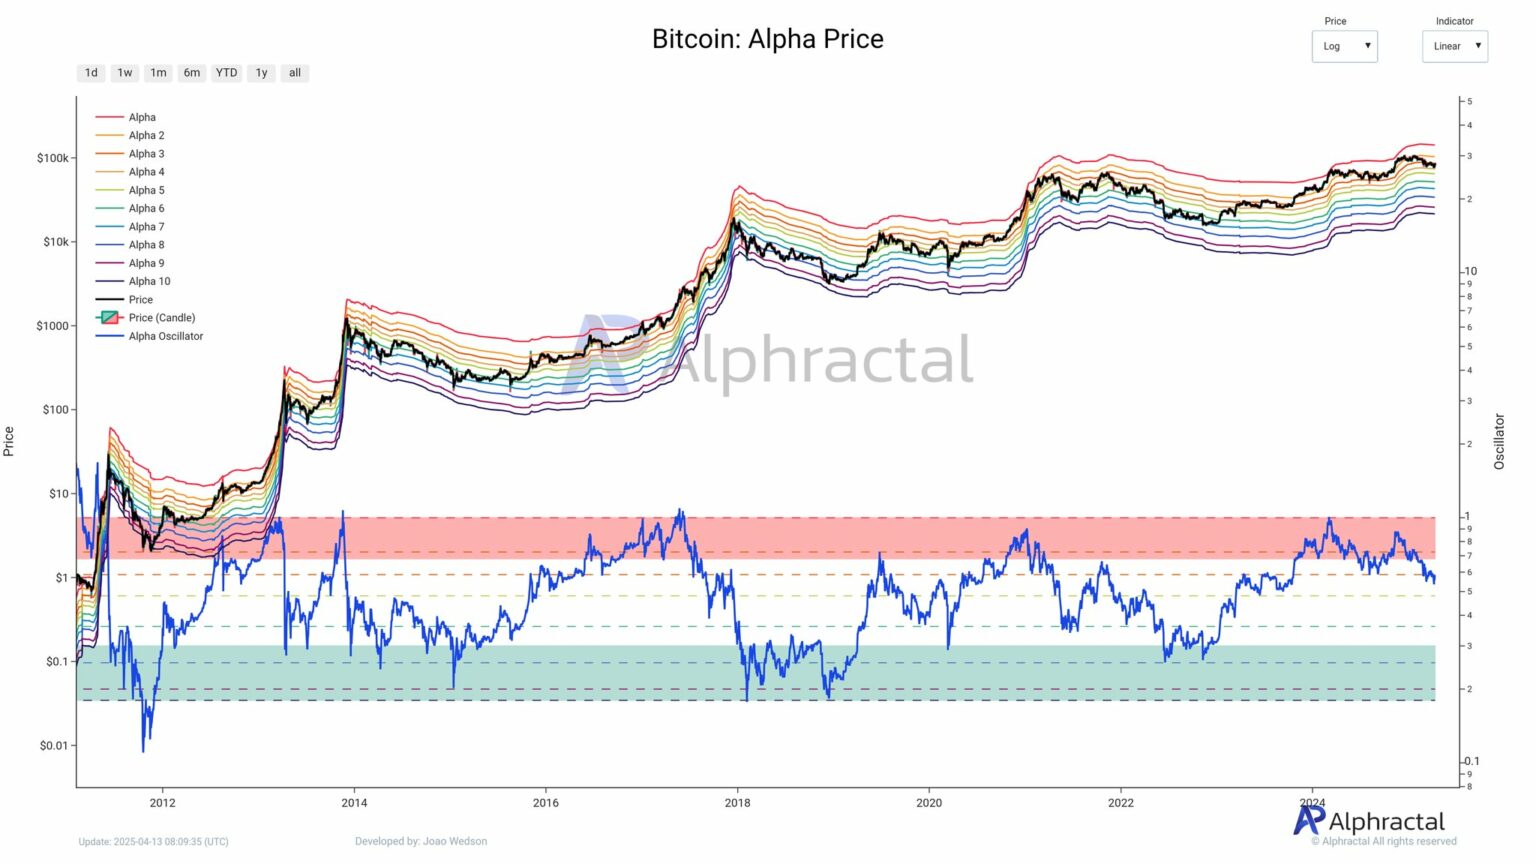 Source: AlphractalThe alpha price chart shows that the price is consolidating just above the key support bands, indicating that distribution is taking place.
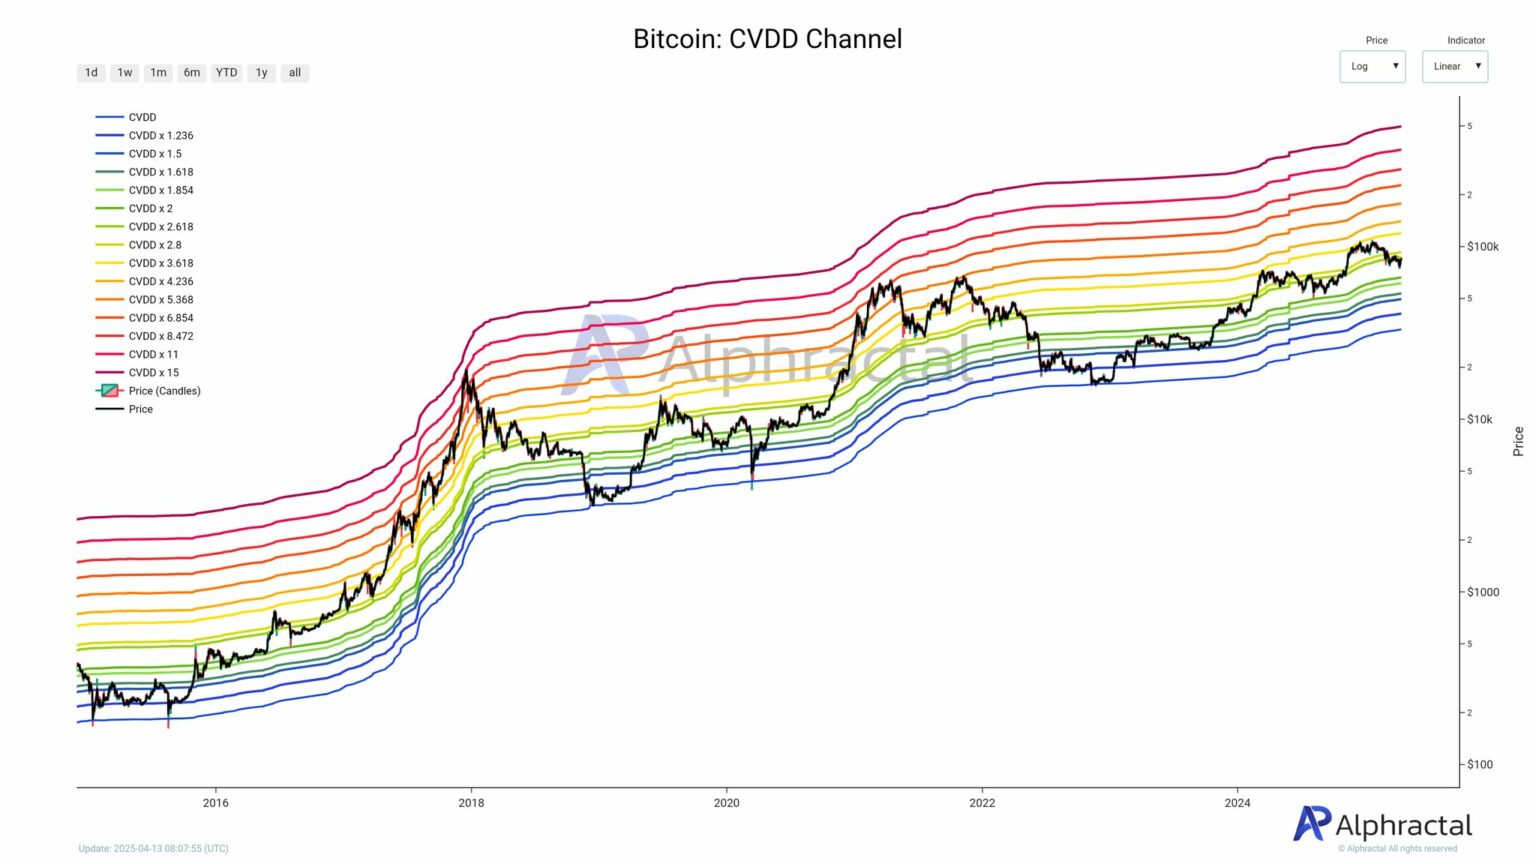 Source: AlphractalMeanwhile, the CVDD Channel highlights the $66,300 area (CVDD x 2,618) as the initial support level, with a deeper bottom near $61,000 (CVDD x 2).
Dropping below these levels indicates an increase in selling pressure. Although BTC has not lost its support levels, data shows that the leading asset still has the potential to reverse and decrease.
This raises speculation about the possibility of capital shifting to altcoins. The coming weeks will be a decisive time for the direction of the market for the rest of the year.
Miners and STH are distributing, LTH remains strong
The psychological bands indicate that Bitcoin is fluctuating in the range of “anxiety” to “hope/denial”, a range that has been associated with redistribution phases.
Miners and short-term holders (STH) seem to be liquidating, with price action clinging to the mid-bands, indicating selling pressure as market participants take profits.
! Source: AlphractalMeanwhile, long-term holders (LTH) have not continued to accumulate; The market has yet to enter their buy zone and we have yet to see clear signs of consolidation.
The lack of trust in LTH reminds us of previous redistribution cycles when prices consolidated or dropped sharply before forming a clearer trend.
Is the altcoin season coming?
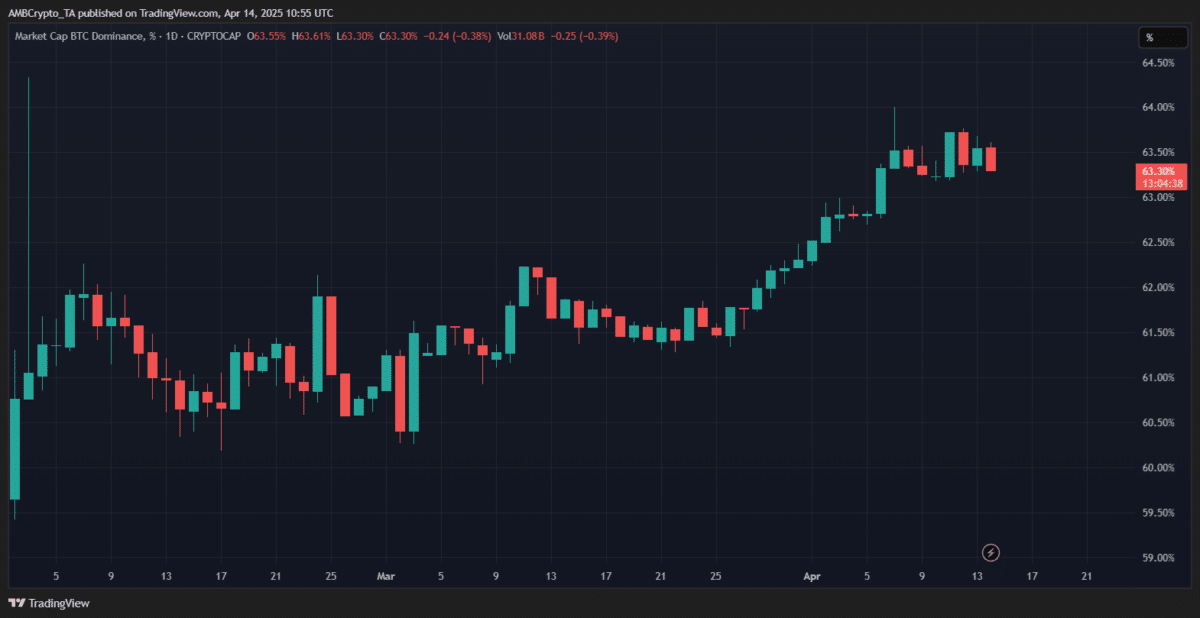 Source: TradingViewAt the current time, the dominance rate of Bitcoin (BTC.D) is at 63.3%, slightly down after steadily increasing since mid-March. Historical data shows that BTC.D is losing momentum just below the 64% mark, acting as a resistance level.
The slowdown refers to the weakening potential of BTC.D, creating opportunities for altcoins to recover.
If Bitcoin’s dominance ratio continues to decline while its price stabilizes or remains within a range, capital may start to shift towards altcoins. This could signal the beginning of an altcoin season.
Although it is still too early to confirm, the continuous rejection of BTC.D around the 64% range may signal the early stage of the altcoin season in October.
You can view the BTC price here.
Disclaimer: This article is for informational purposes only and is not investment advice. Investors should do their own research before making any decisions. We are not responsible for your investment decisions.
- 3 old altcoins signaling price increase – Is a surge approaching?
- The Trump administration plans to buy Bitcoin with tariff revenue: BTC heads towards the $90,000 mark
- Top 3 notable “made in USA” altcoins in the third week of April
Viet Cuong
@media only screen and (min-width: 0px) and (min-height: 0px) {
div[id^=“wrapper-sevio-d89f58f5-7b63-40be-98c0-6b1fd62584fb”] {
width:320px;
height: 100px;
}
}
@media only screen and (min-width: 728px) and (min-height: 0px) {
div[id^=“wrapper-sevio-d89f58f5-7b63-40be-98c0-6b1fd62584fb”] {
width: 728px;
height: 90px;
}
}
Disclaimer: The information on this page may come from third parties and does not represent the views or opinions of Gate. The content displayed on this page is for reference only and does not constitute any financial, investment, or legal advice. Gate does not guarantee the accuracy or completeness of the information and shall not be liable for any losses arising from the use of this information. Virtual asset investments carry high risks and are subject to significant price volatility. You may lose all of your invested principal. Please fully understand the relevant risks and make prudent decisions based on your own financial situation and risk tolerance. For details, please refer to
Disclaimer.
