Ethereum Faces Key $3,400 Resistance: Is a Breakout Imminent or a Pullback Ahead?

Last Updated 2026-03-25 22:45:29
Reading Time: 1m
Ethereum has recently tested the $3,400 resistance level several times, fueling widespread debate about the market’s trajectory. Drawing on the latest price action, trading volume, technical patterns, and fundamental developments, this article provides an objective analysis of whether ETH is positioned for a breakout or is likely to face short-term pullback pressure.

1. Latest Ethereum Price Overview


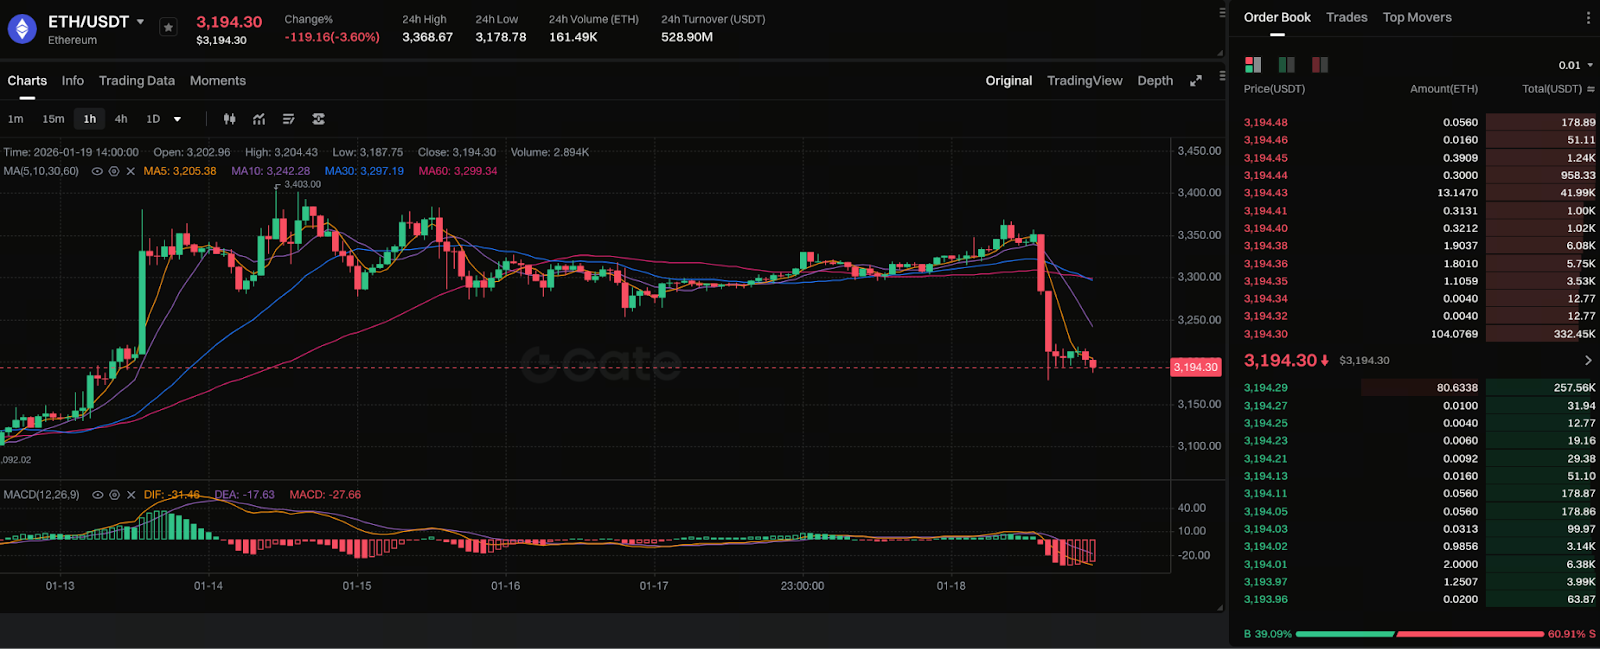
Chart: https://www.gate.com/trade/ETH_USDT

As of January 19, 2026, Ethereum (ETH) has been trading in the $3,200–$3,400 range, repeatedly attempting upward breakouts but still unable to establish a sustained move above resistance. Bulls and bears are locked in a clear standoff near critical price levels, and market sentiment is increasingly split on the next direction. Bulls are pushing for a decisive breakout to open further upside, while bears are leveraging the resistance zone to drive short-term pullbacks.

2. Why $3,400 Is a Key Resistance Level

The $3,400 mark is regarded as a major inflection point for Ethereum’s short- and medium-term trend due to several factors:

First, this price level coincides with a previous concentration of trading activity—a zone where many historical positions are clustered and investors are likely to take profits.

Second, from a technical perspective, the overlap of Fibonacci retracement, structural resistance, and major horizontal support lines makes $3,400 a formidable barrier. ETH needs substantial volume to challenge and break through this area.

Third, institutions and large holders have repeatedly initiated short-term sell orders in this region, meaning a successful breakout requires clear buying power.

Thus, $3,400 is not only a psychological threshold but also embodies structural market pressure.

3. Technical Analysis: Breakout Signals and Pullback Conditions

For a true breakout, several conditions must be met:

  • First, the closing price must remain above $3,400, accompanied by a surge in trading volume.
  • Second, the daily chart should show a sustained bullish pattern, including clear upward divergence in the moving averages.
  • Third, there should be a noticeable net inflow of capital, along with rising on-chain activity.

If these conditions are not met, the likelihood of a pullback increases. Specifically, if ETH posts a long upper shadow or volume declines near $3,400, the price may retreat to the $3,200 or even $3,100 range for support testing.

Recent market data also suggests that high time-frame resistance is suppressing ETH, and trading volume has not risen significantly, increasing short-term pullback risk.

4. Impact of Fundamental Changes on ETH

In addition to technical factors, fundamental changes are also key drivers of ETH’s price action. Recently, transaction activity and staking volume on the Ethereum network have shown moderate growth, providing long-term value support. Institutional interest in ETH is also rising, as evidenced by increased discussions of ETF products and shifts in capital flows, which shape expectations for future market trends.

However, potential headwinds remain. Periodic large wallet sell-offs may impact short-term price movements, while the pace of Ethereum network upgrades, gas costs, and competition from rival blockchains could also create challenges.

5. Market Sentiment and Capital Flows

Overall, ETH investors maintain a cautiously optimistic outlook, but there are no signs of aggressive buying. Capital flow data shows that while institutions are increasing their long-term ETH allocations, short-term capital tends to reduce positions near key resistance. Broader macro factors—such as shifting Federal Reserve policy expectations and the overall risk asset environment—also influence ETH’s short-term volatility.

Until sentiment shifts decisively and capital flows accelerate, a breakout will depend on whether the market can generate collective momentum.

6. Key Price Levels and Strategic Reference for the Coming Market

Looking ahead, the following levels warrant close attention:

  • First, whether $3,400 can be decisively broken and held—this is critical for trend direction.
  • Second, if a pullback occurs, $3,200 is a major short-term support. If breached, $3,100 may be tested next.
  • Third, if a breakout is confirmed, the $3,500–$3,800 range will be the next target zone.

Investors should tailor their strategies based on breakout scenarios to mitigate risks from uncertain market conditions.

7. Conclusion: Assessing ETH’s Potential Trend

In summary, Ethereum’s performance at the $3,400 level will shape its short-term trajectory. If trading volume and market sentiment improve in tandem, the odds of a breakout rise substantially. Conversely, repeated failures and pullbacks could lead to consolidation or a short-term correction cycle. The market is at a pivotal juncture, and investors should closely monitor price structure, trading volume shifts, and macroeconomic signals in concert.

Author: Max
Disclaimer
* The information is not intended to be and does not constitute financial advice or any other recommendation of any sort offered or endorsed by Gate.
* This article may not be reproduced, transmitted or copied without referencing Gate. Contravention is an infringement of Copyright Act and may be subject to legal action.

Related Articles

AI-Native Settlement Layers: How United Stables Is Building the Next Financial Rail
Beginner

AI-Native Settlement Layers: How United Stables Is Building the Next Financial Rail

Stablecoins were originally designed as dollar substitutes within exchanges, primarily used for asset pricing and trade settlement. As on-chain financial ecosystems have matured, their role has expanded beyond simple payments to include collateral assets, cross-chain liquidity mediums, and unified settlement units. In particular, as AI systems and automated agents begin to participate directly in economic activity, demand has risen sharply for programmable value units capable of instant settlement. This shift is pushing stablecoins toward the role of foundational financial infrastructure.
2026-03-25 03:16:17
The ve(3,3) Flywheel Explained: How AERO Tokenomics Powers Aerodrome’s DeFi Economy
Beginner

The ve(3,3) Flywheel Explained: How AERO Tokenomics Powers Aerodrome’s DeFi Economy

In the competition for DeFi liquidity, high-inflation mining alone is no longer enough to build lasting advantages. Aerodrome applies the ve(3,3) economic model to redesign token emissions, voting mechanisms, and revenue distribution, creating a liquidity flywheel centered on governance and cash flow. This article examines AERO tokenomics, the veAERO locking mechanism, and protocol revenue models to explain how Aerodrome builds a sustainable DeFi economic system.
2026-03-25 06:41:58
Aerodrome Tokenomics: How ve(3,3) Powers Base's Most Profitable DEX
Beginner

Aerodrome Tokenomics: How ve(3,3) Powers Base's Most Profitable DEX

AERO is the native token of Aerodrome Finance, a core decentralized exchange and liquidity protocol in the Base ecosystem. It is primarily used for liquidity incentives and ecosystem operations. veAERO is a governance NFT that users receive by locking AERO, representing both voting power and the right to share protocol revenue. Through a dual track structure of AERO as a utility token and veAERO as a governance credential, Aerodrome separates liquidity usage value from long term governance power, allowing participants to act as liquidity providers, governance decision makers, and revenue sharers within the same system.
2026-03-25 06:40:31
How Does PAXG Work? In-Depth Overview of the Physical Gold Tokenization Mechanism
Beginner

How Does PAXG Work? In-Depth Overview of the Physical Gold Tokenization Mechanism

PAXG (Pax Gold) is a tokenized asset backed by physical gold, issued by the fintech company Paxos and traded on the Ethereum blockchain as an ERC-20 token. The core concept is to tokenize physical gold on-chain, with each PAXG token representing ownership of a certain amount of gold. This structure enables investors to hold and trade gold in the form of a digital asset.
2026-03-24 19:12:51
How is the price of PAXG determined? Pegging mechanism, trading depth, and influencing factors
Beginner

How is the price of PAXG determined? Pegging mechanism, trading depth, and influencing factors

PAXG (Pax Gold) is a tokenized asset backed by physical gold reserves, launched by fintech firm Paxos and issued as an ERC-20 token on the Ethereum blockchain. The core concept is to digitally represent real-world gold assets, allowing investors to hold and trade gold via the blockchain network. Because each PAXG token corresponds to a specific quantity of physical gold, its price is theoretically expected to closely track the global gold market.
2026-03-24 19:11:40
Aster vs Hyperliquid: Which Perp DEX Will Prevail?
Beginner

Aster vs Hyperliquid: Which Perp DEX Will Prevail?

Aster and Hyperliquid are the two representative protocols of the "purpose-built L1 path" within the current decentralized perpetual exchange (Perp DEX) sector. As a pioneer in the field, Hyperliquid has built a deep liquidity moat through its highly mature order book architecture and strong community consensus. Conversely, Aster, as a rising challenger, seeks to leapfrog the competition in high-performance trading through more aggressive multi-chain aggregation logic, private transaction modules, and an underlying execution environment optimized for 2026 market demands.
2026-03-24 11:58:33